Some statistical notes on housing in Brunswick, Maine
Renters, vacancy rates, and short-term rentals
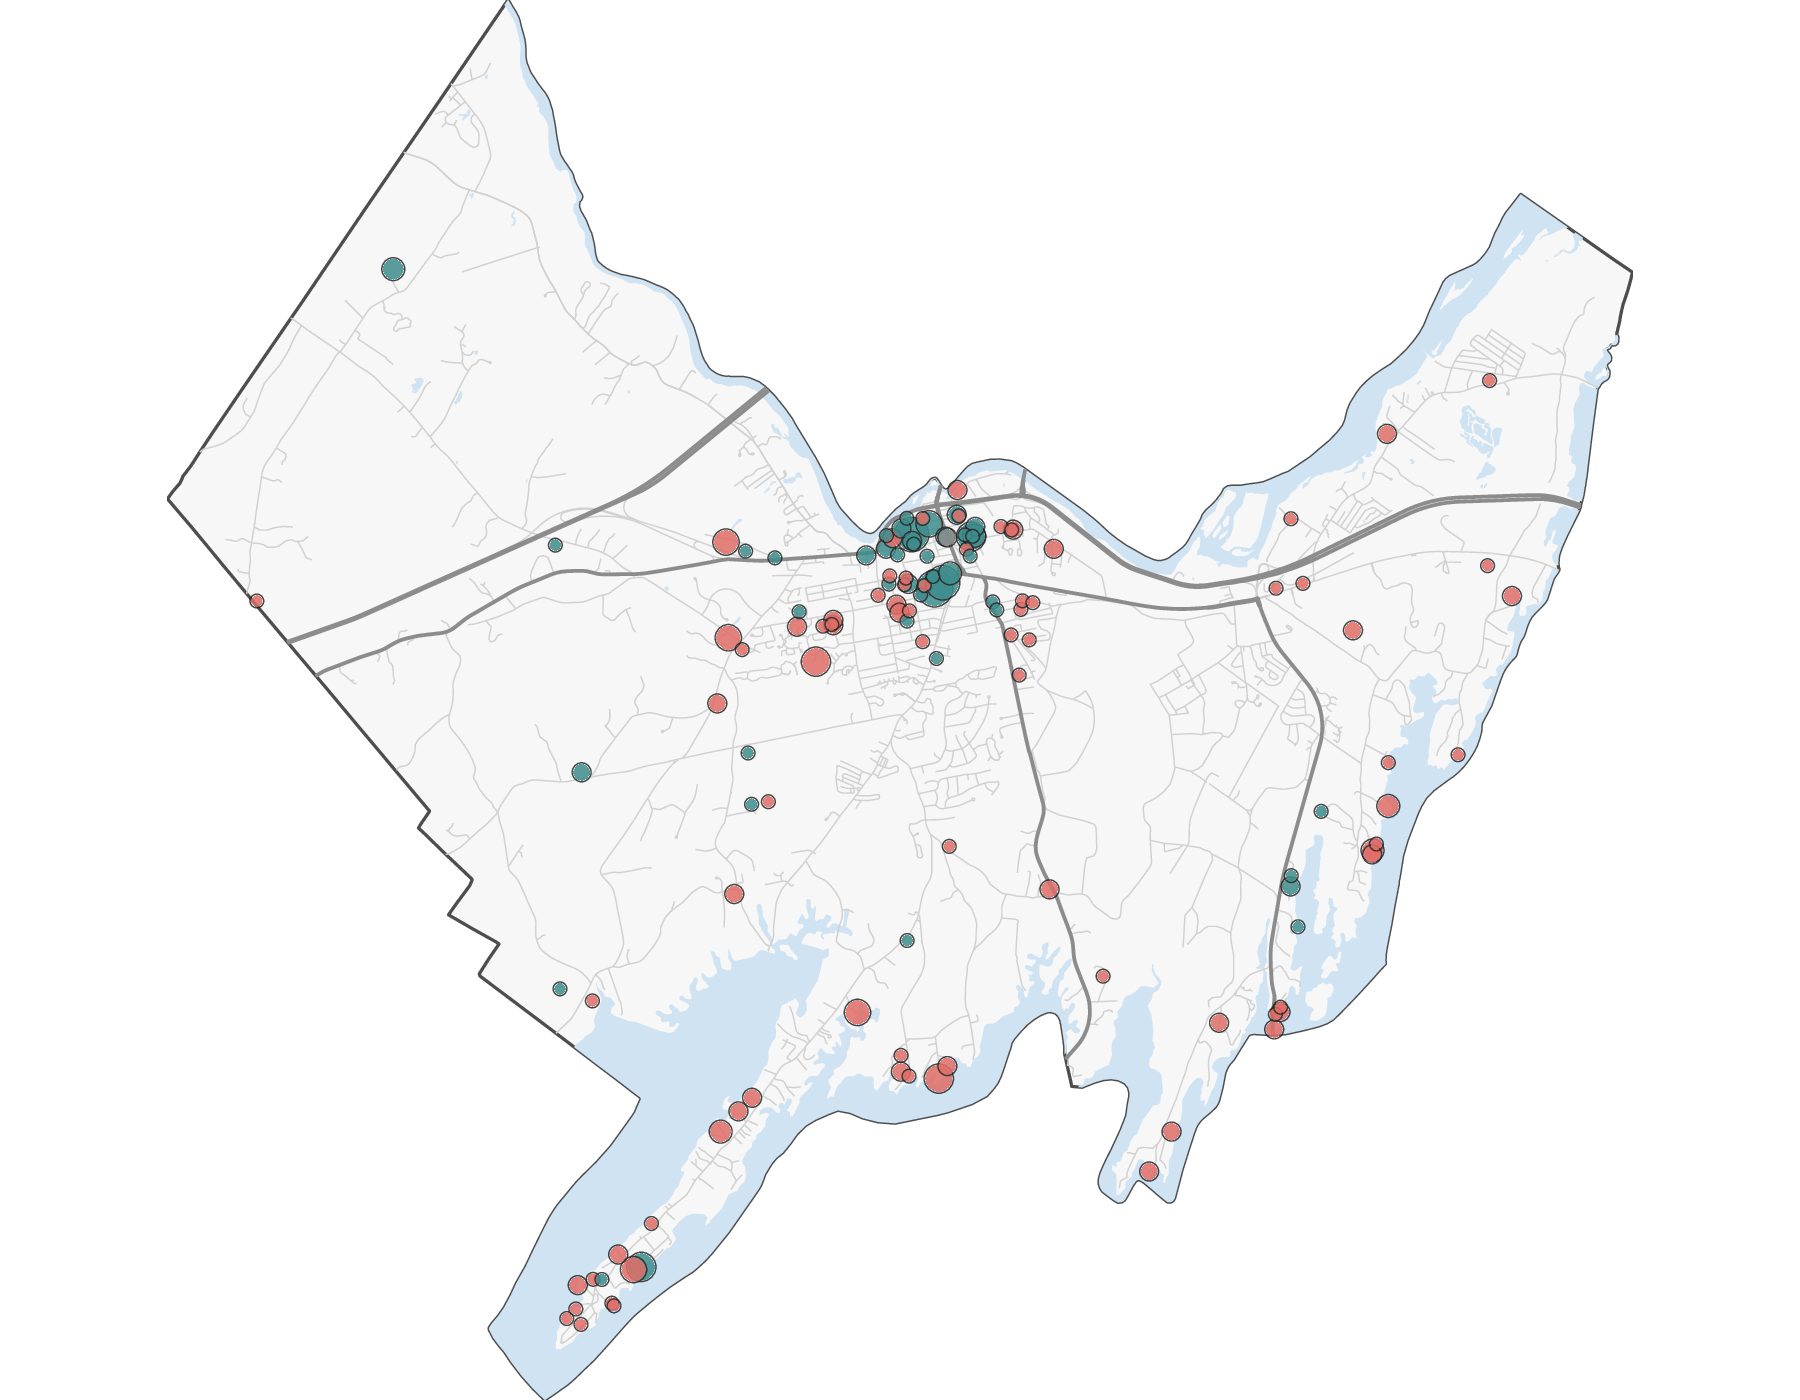
![Map of Brunswick, Maine, with a dot for each short-term rental listing]()
Jack O’Brien · October 2026 · Version 2
Main arguments
(Primarily) Renters in Brunswick are struggling.
More than half of renters spend too much of their income on housing, and it is getting worse. Rents for apartments on the market are far above what a typical renter can pay.
Rents are rising because there are almost no empty rentals.
When few apartments are empty, renters compete for them and rents go up. A town needs some empty rentals, roughly 6–7% of them, for rents to hold steady. Brunswick has close to none.
Short-term rentals take up a large share of the room the town needs.
Homes rented to visitors (on sites like Airbnb) are not available to people who live here. The ones we can locate alone equal more than half (about 55%) of the empty rentals a healthy market needs.
Some useful terms
- Cost burdened: a household that spends 30% or more of its income on housing (rent and utilities for renters; mortgage, taxes, and insurance for owners). This is the federal government’s standard.
- Vacancy rate: of all the rental homes in town, the share that are empty and available to rent.
- Short-term rental (STR): a home rented to visitors for short stays, often through Airbnb or Vrbo, instead of to someone who lives here.
- American Community Survey (ACS): a survey the U.S. Census Bureau runs every year. For a town the size of Brunswick, it combines 5 years of answers; “2020–2024” means one estimate built from those 5 years.
Part 1: Renters are struggling
Who has trouble paying for housing in Brunswick?
About 1 in 3 Brunswick households spends too much on housing
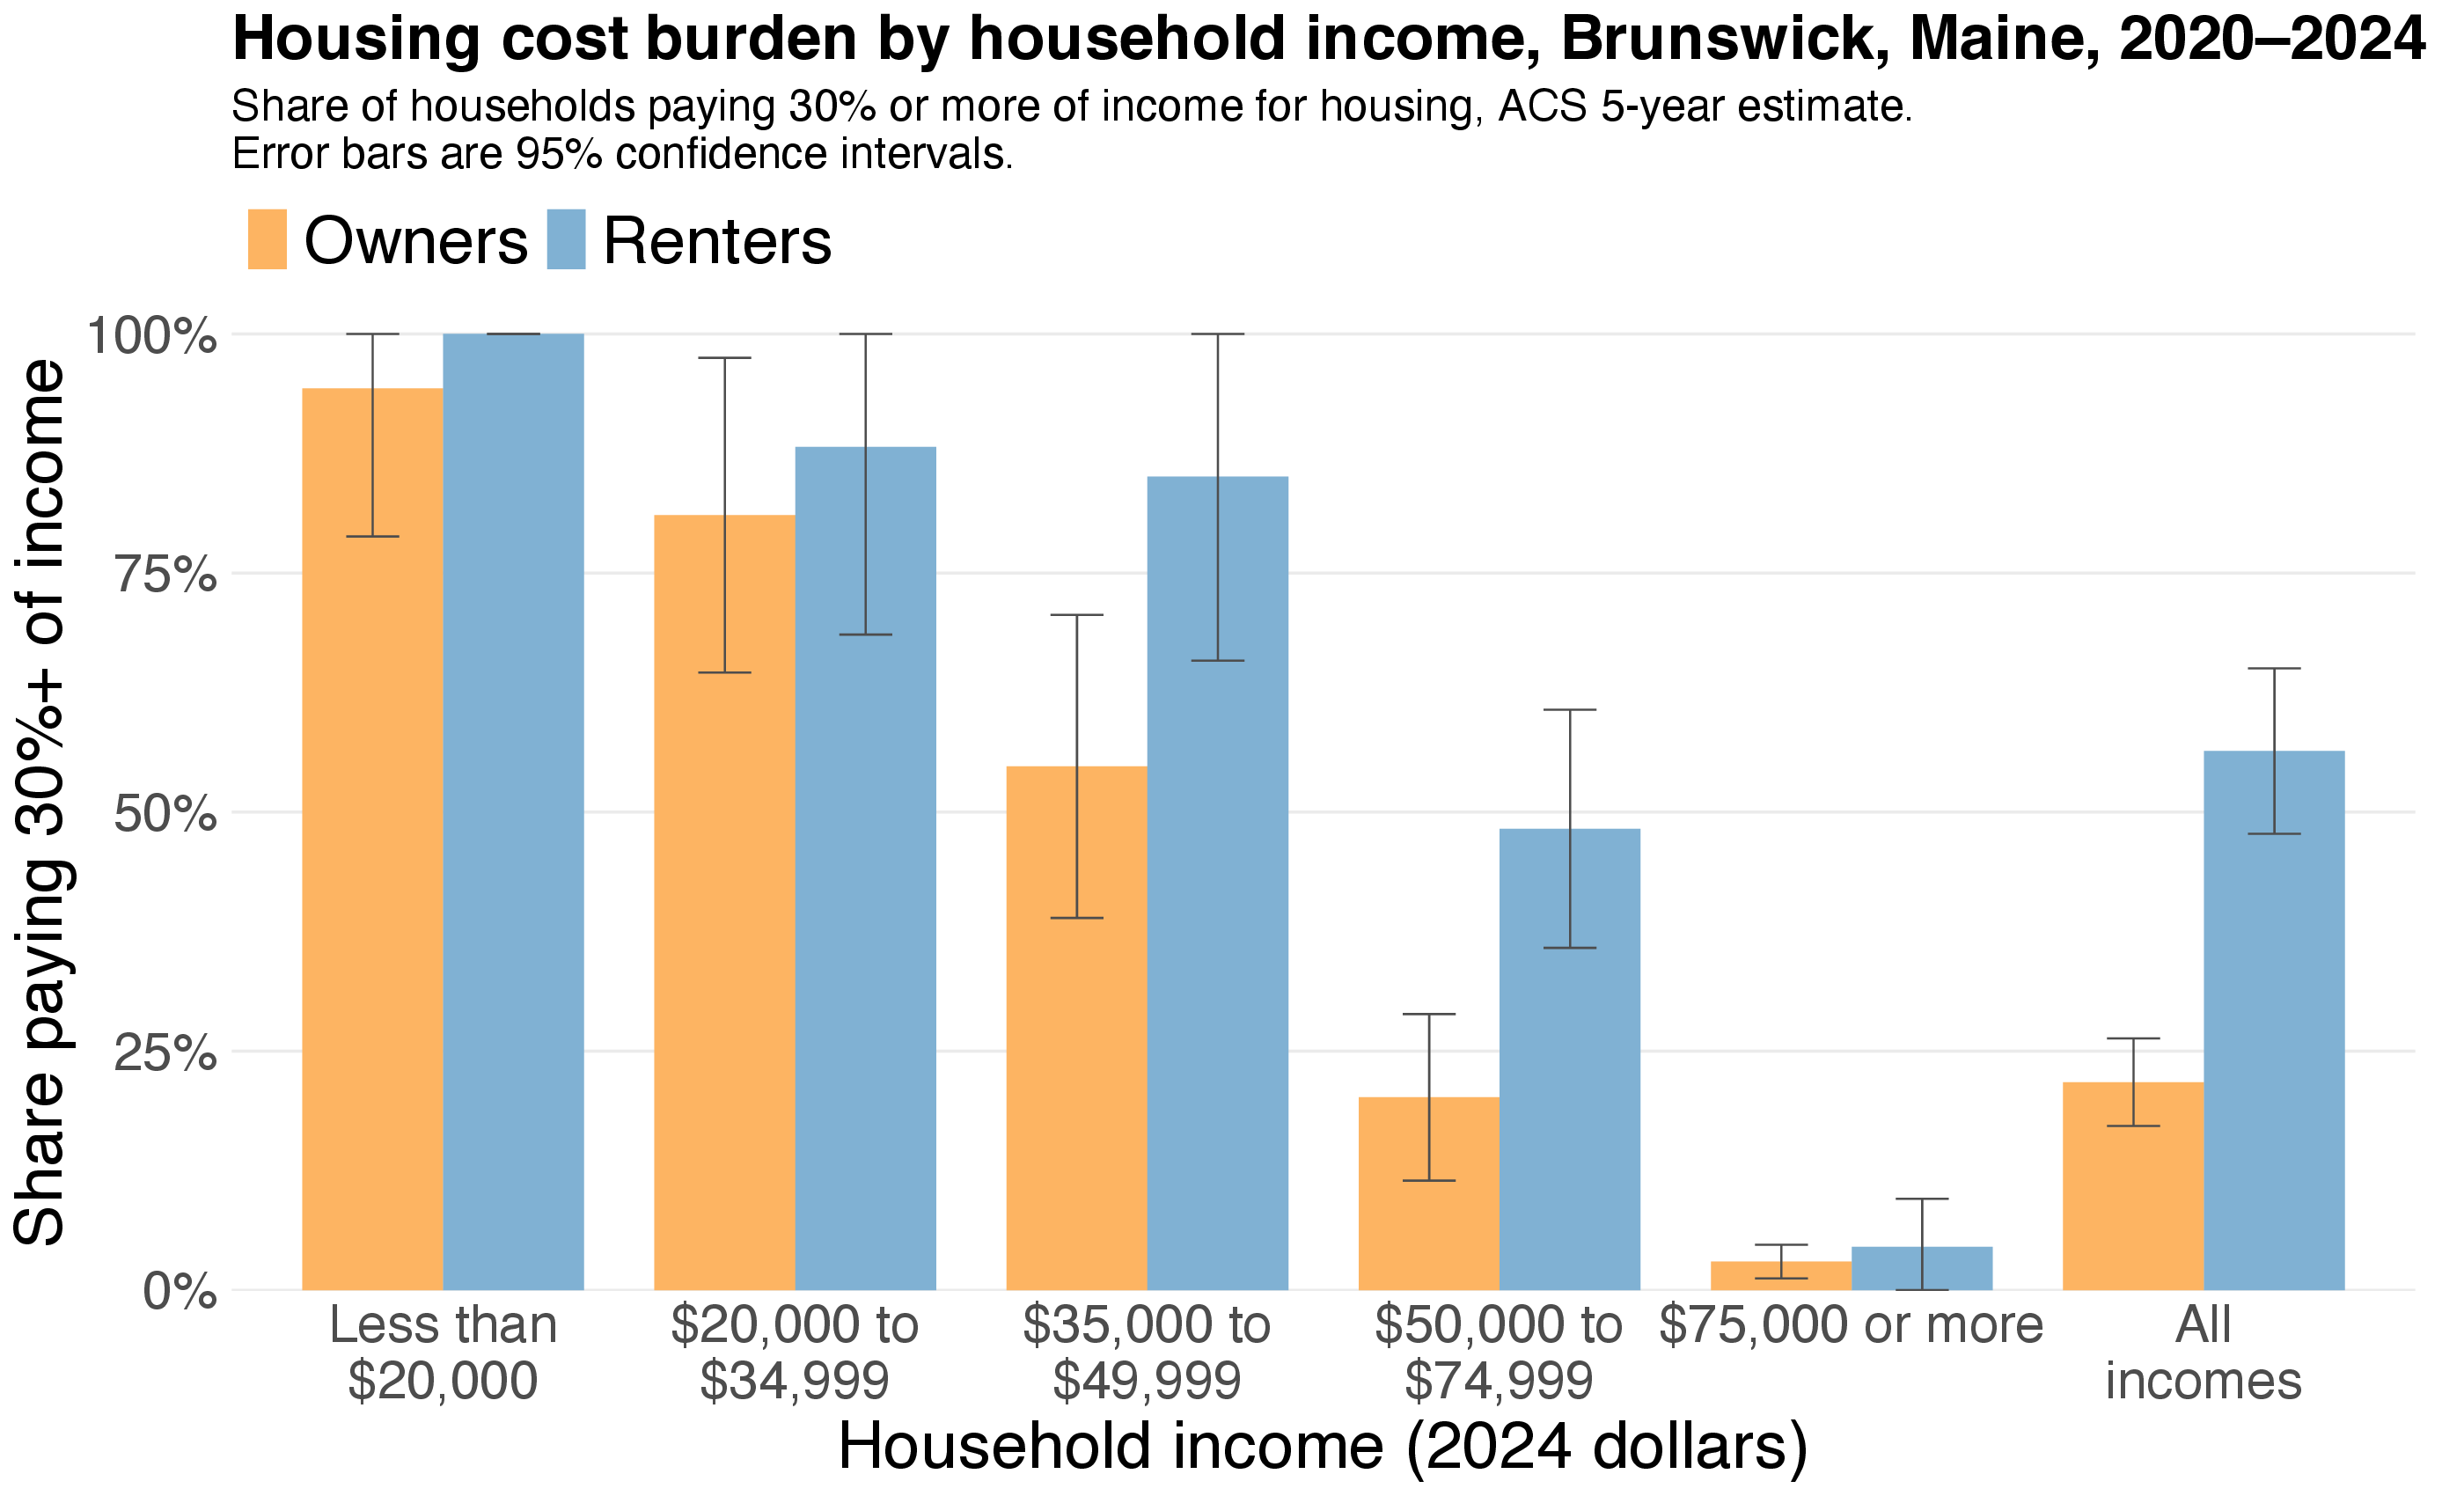
![Bar chart: share of Brunswick households paying 30% or more of income for housing, by income, owners and renters]()
- 31% of all Brunswick households are cost burdened.
- Among renters, 56% are cost burdened. Among owners, 22% are.
- At every income level, renters are burdened more often than owners.
Renters are far more likely to be burdened than owners
Households in Brunswick, ACS 2020–2024
| Renters |
1,374 |
1,063 |
1.29 |
| Owners |
1,367 |
4,917 |
0.28 |
- The odds compare the burdened to the not burdened. For renters, 1,374 ÷ 1,063 ≈ 1.3: about 13 burdened renters for every 10 who are not.
- For owners, 1,367 ÷ 4,917 ≈ 0.28: about 3 burdened owners for every 10 who are not.
- 1.29 ÷ 0.28 ≈ 4.6, so the odds that a renter is cost burdened are more than four times the odds for an owner.
The housing crisis is largely a rental crisis
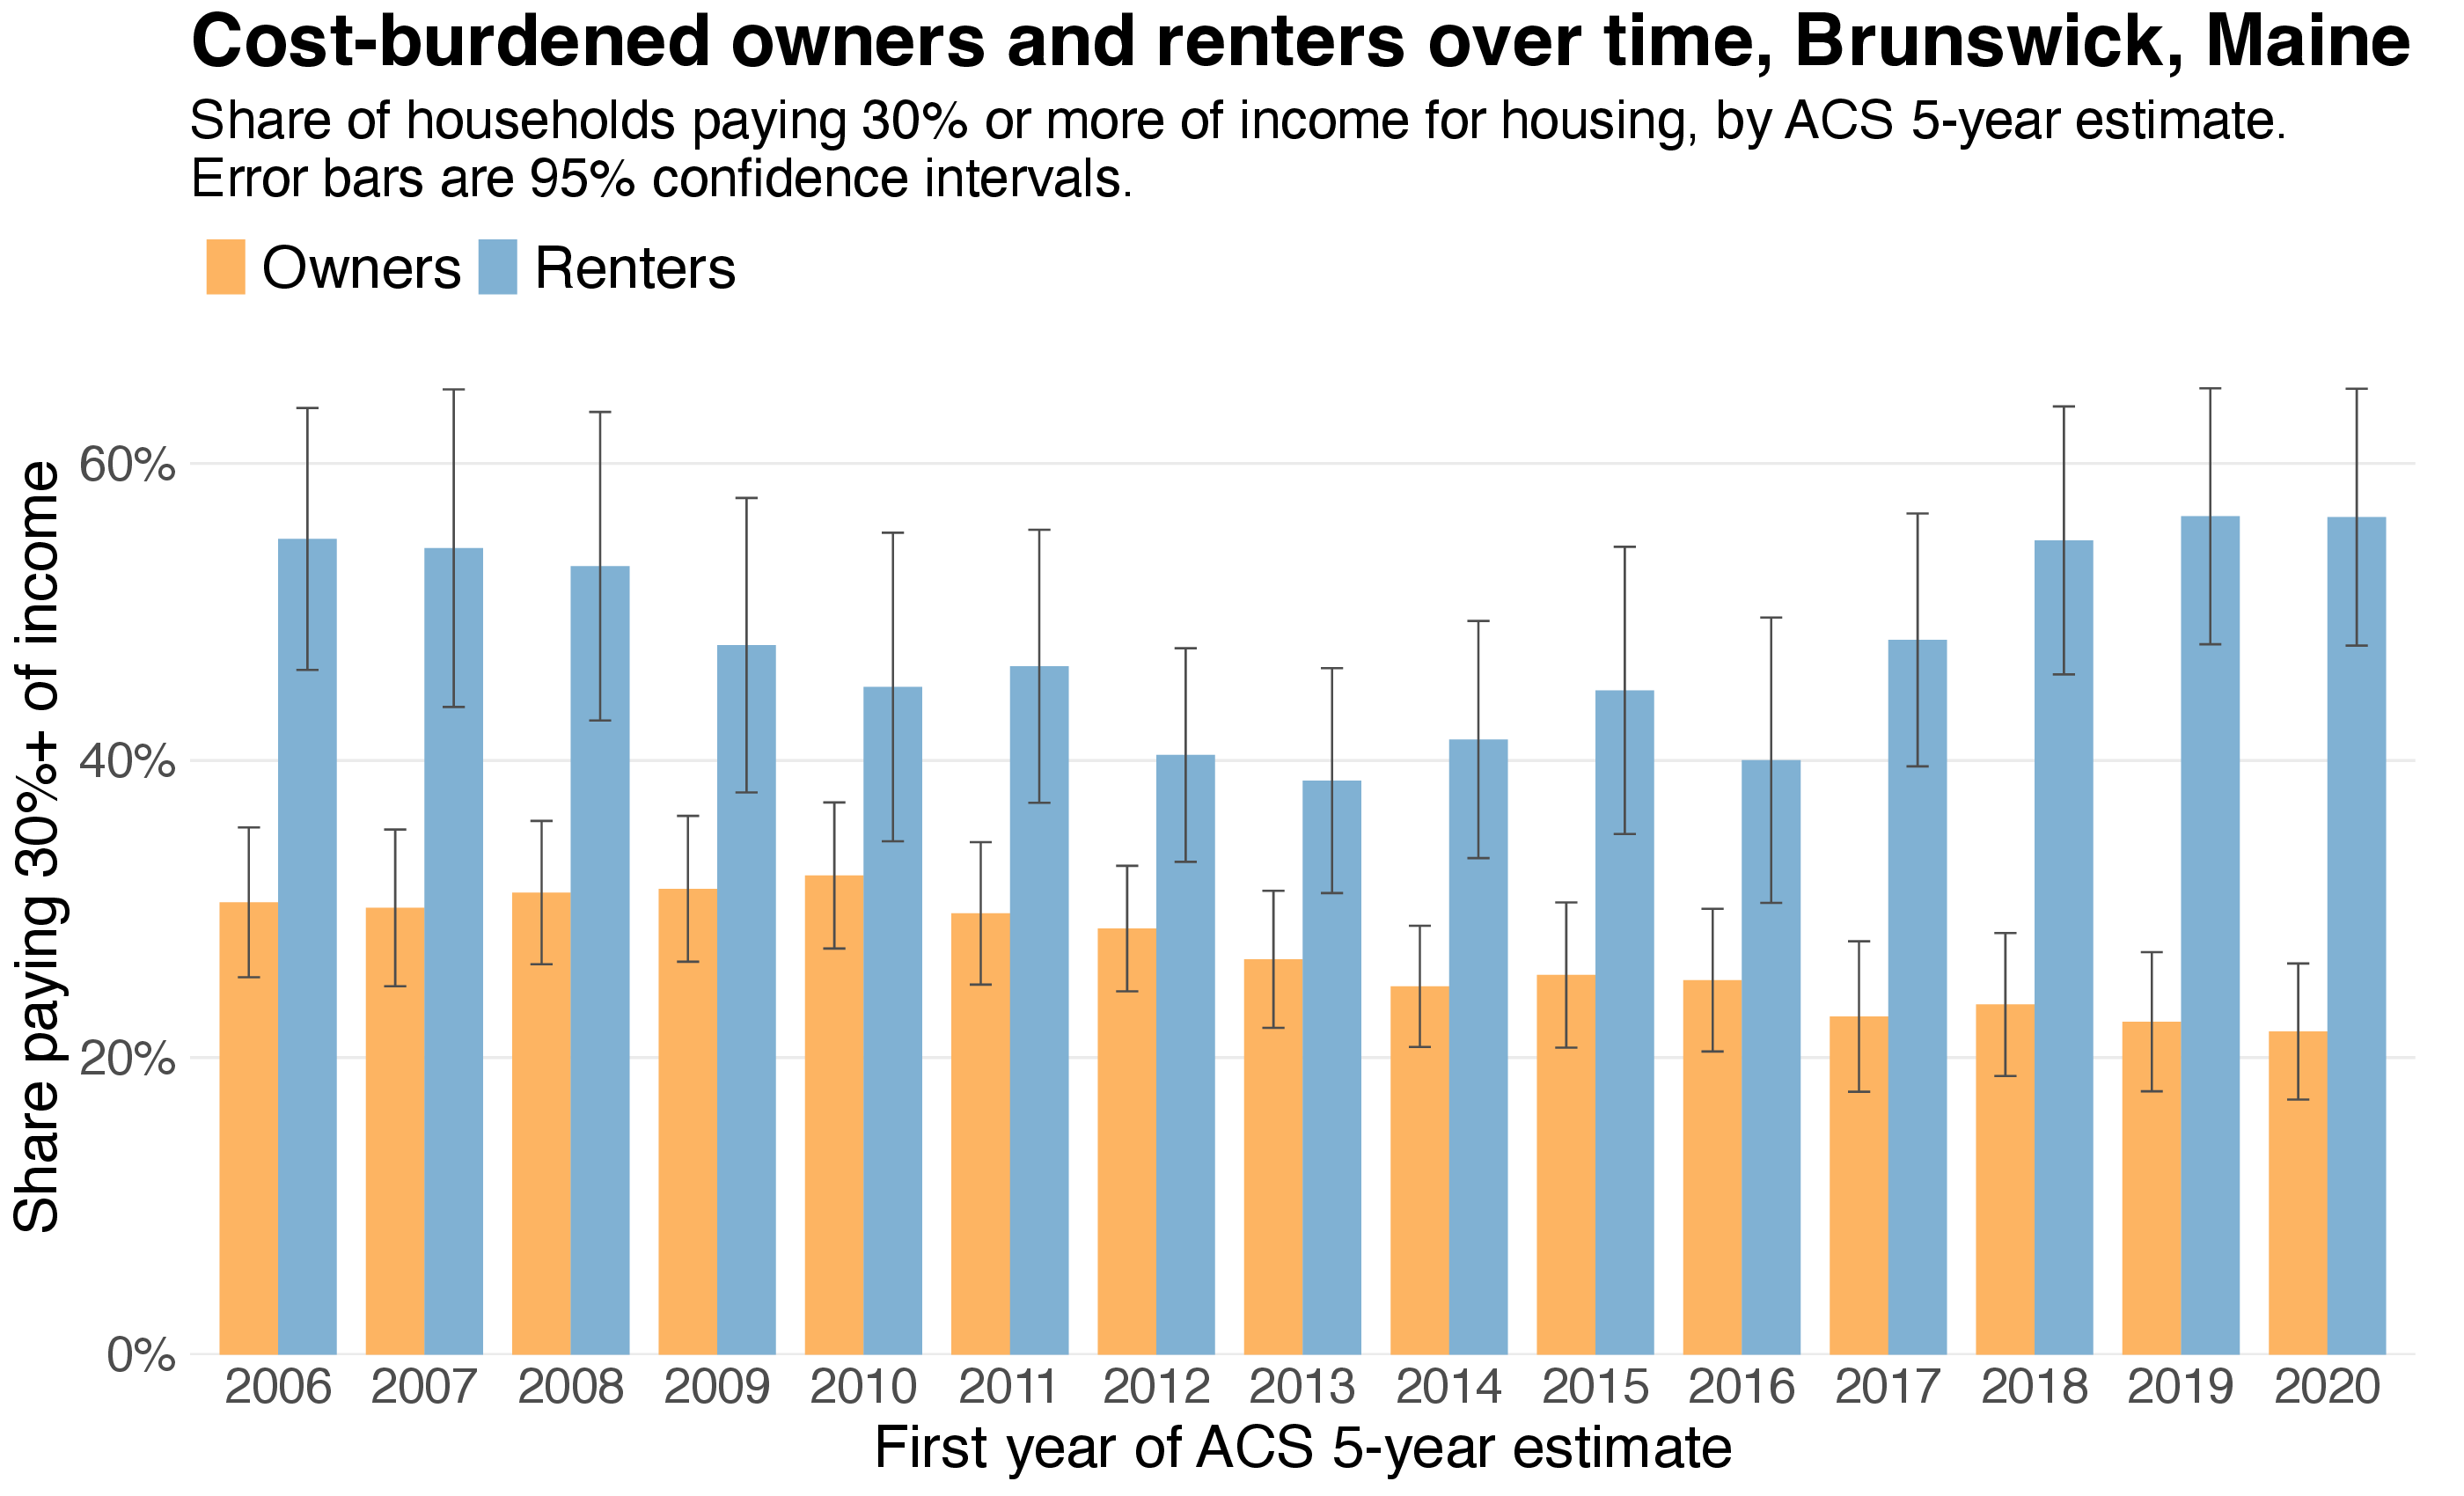
![Share of renters and owners who are cost burdened in each ACS 5-year estimate]()
- The difference between rental and owner burdens is getting worse.
What can a typical renter afford?
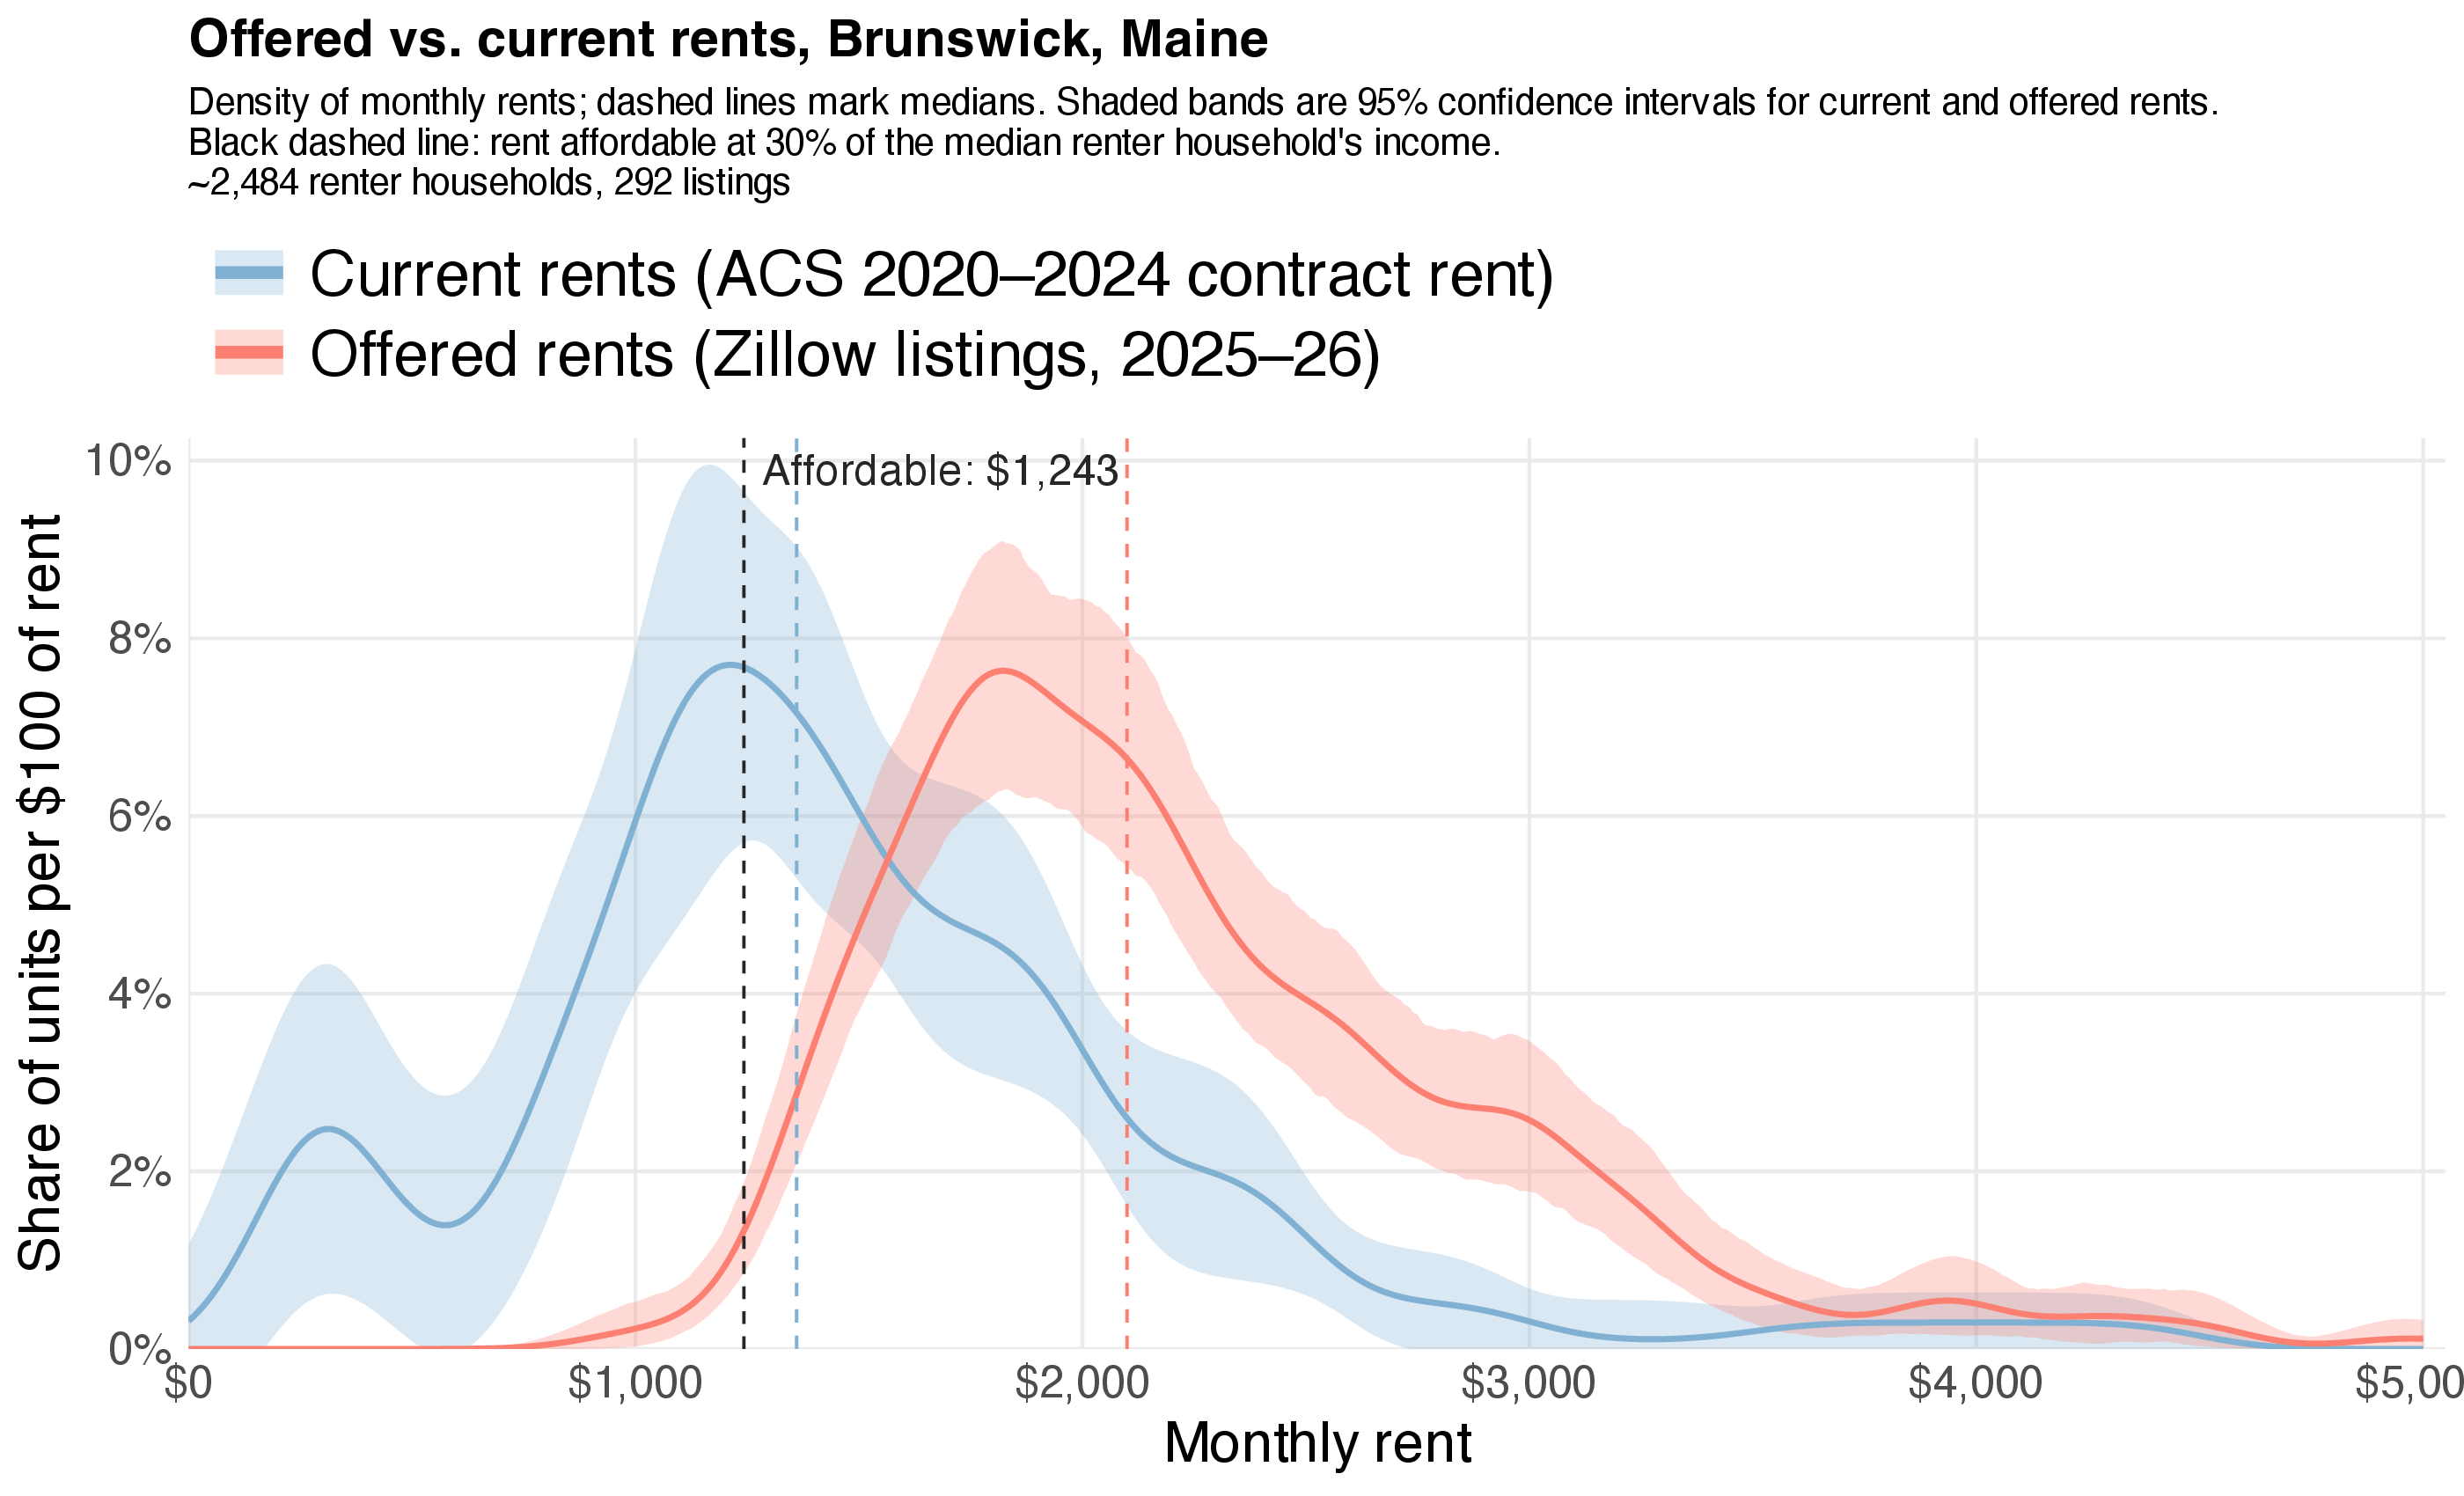
- The median renter household in Brunswick earns about $49,700 a year.
- Spending 30% of that on housing comes to $1,243 a month. That is the most this household can pay without being cost burdened.
- Half of current renters pay more than $1,360 a month.
- Half of the apartments listed for rent on Zillow ask more than $2,100 a month.
| Affordable for the median renter |
$1,243 |
| Median rent, current renters |
$1,360 |
| Median asking rent, new listings |
$2,100 |
Someone looking for an apartment today faces rents about $850 a month above what the typical renter can afford.
Rents for new tenants are far above what renters can afford
![Distributions of rents paid by current renters and asking rents on Zillow, with the affordable rent for the median renter marked]()
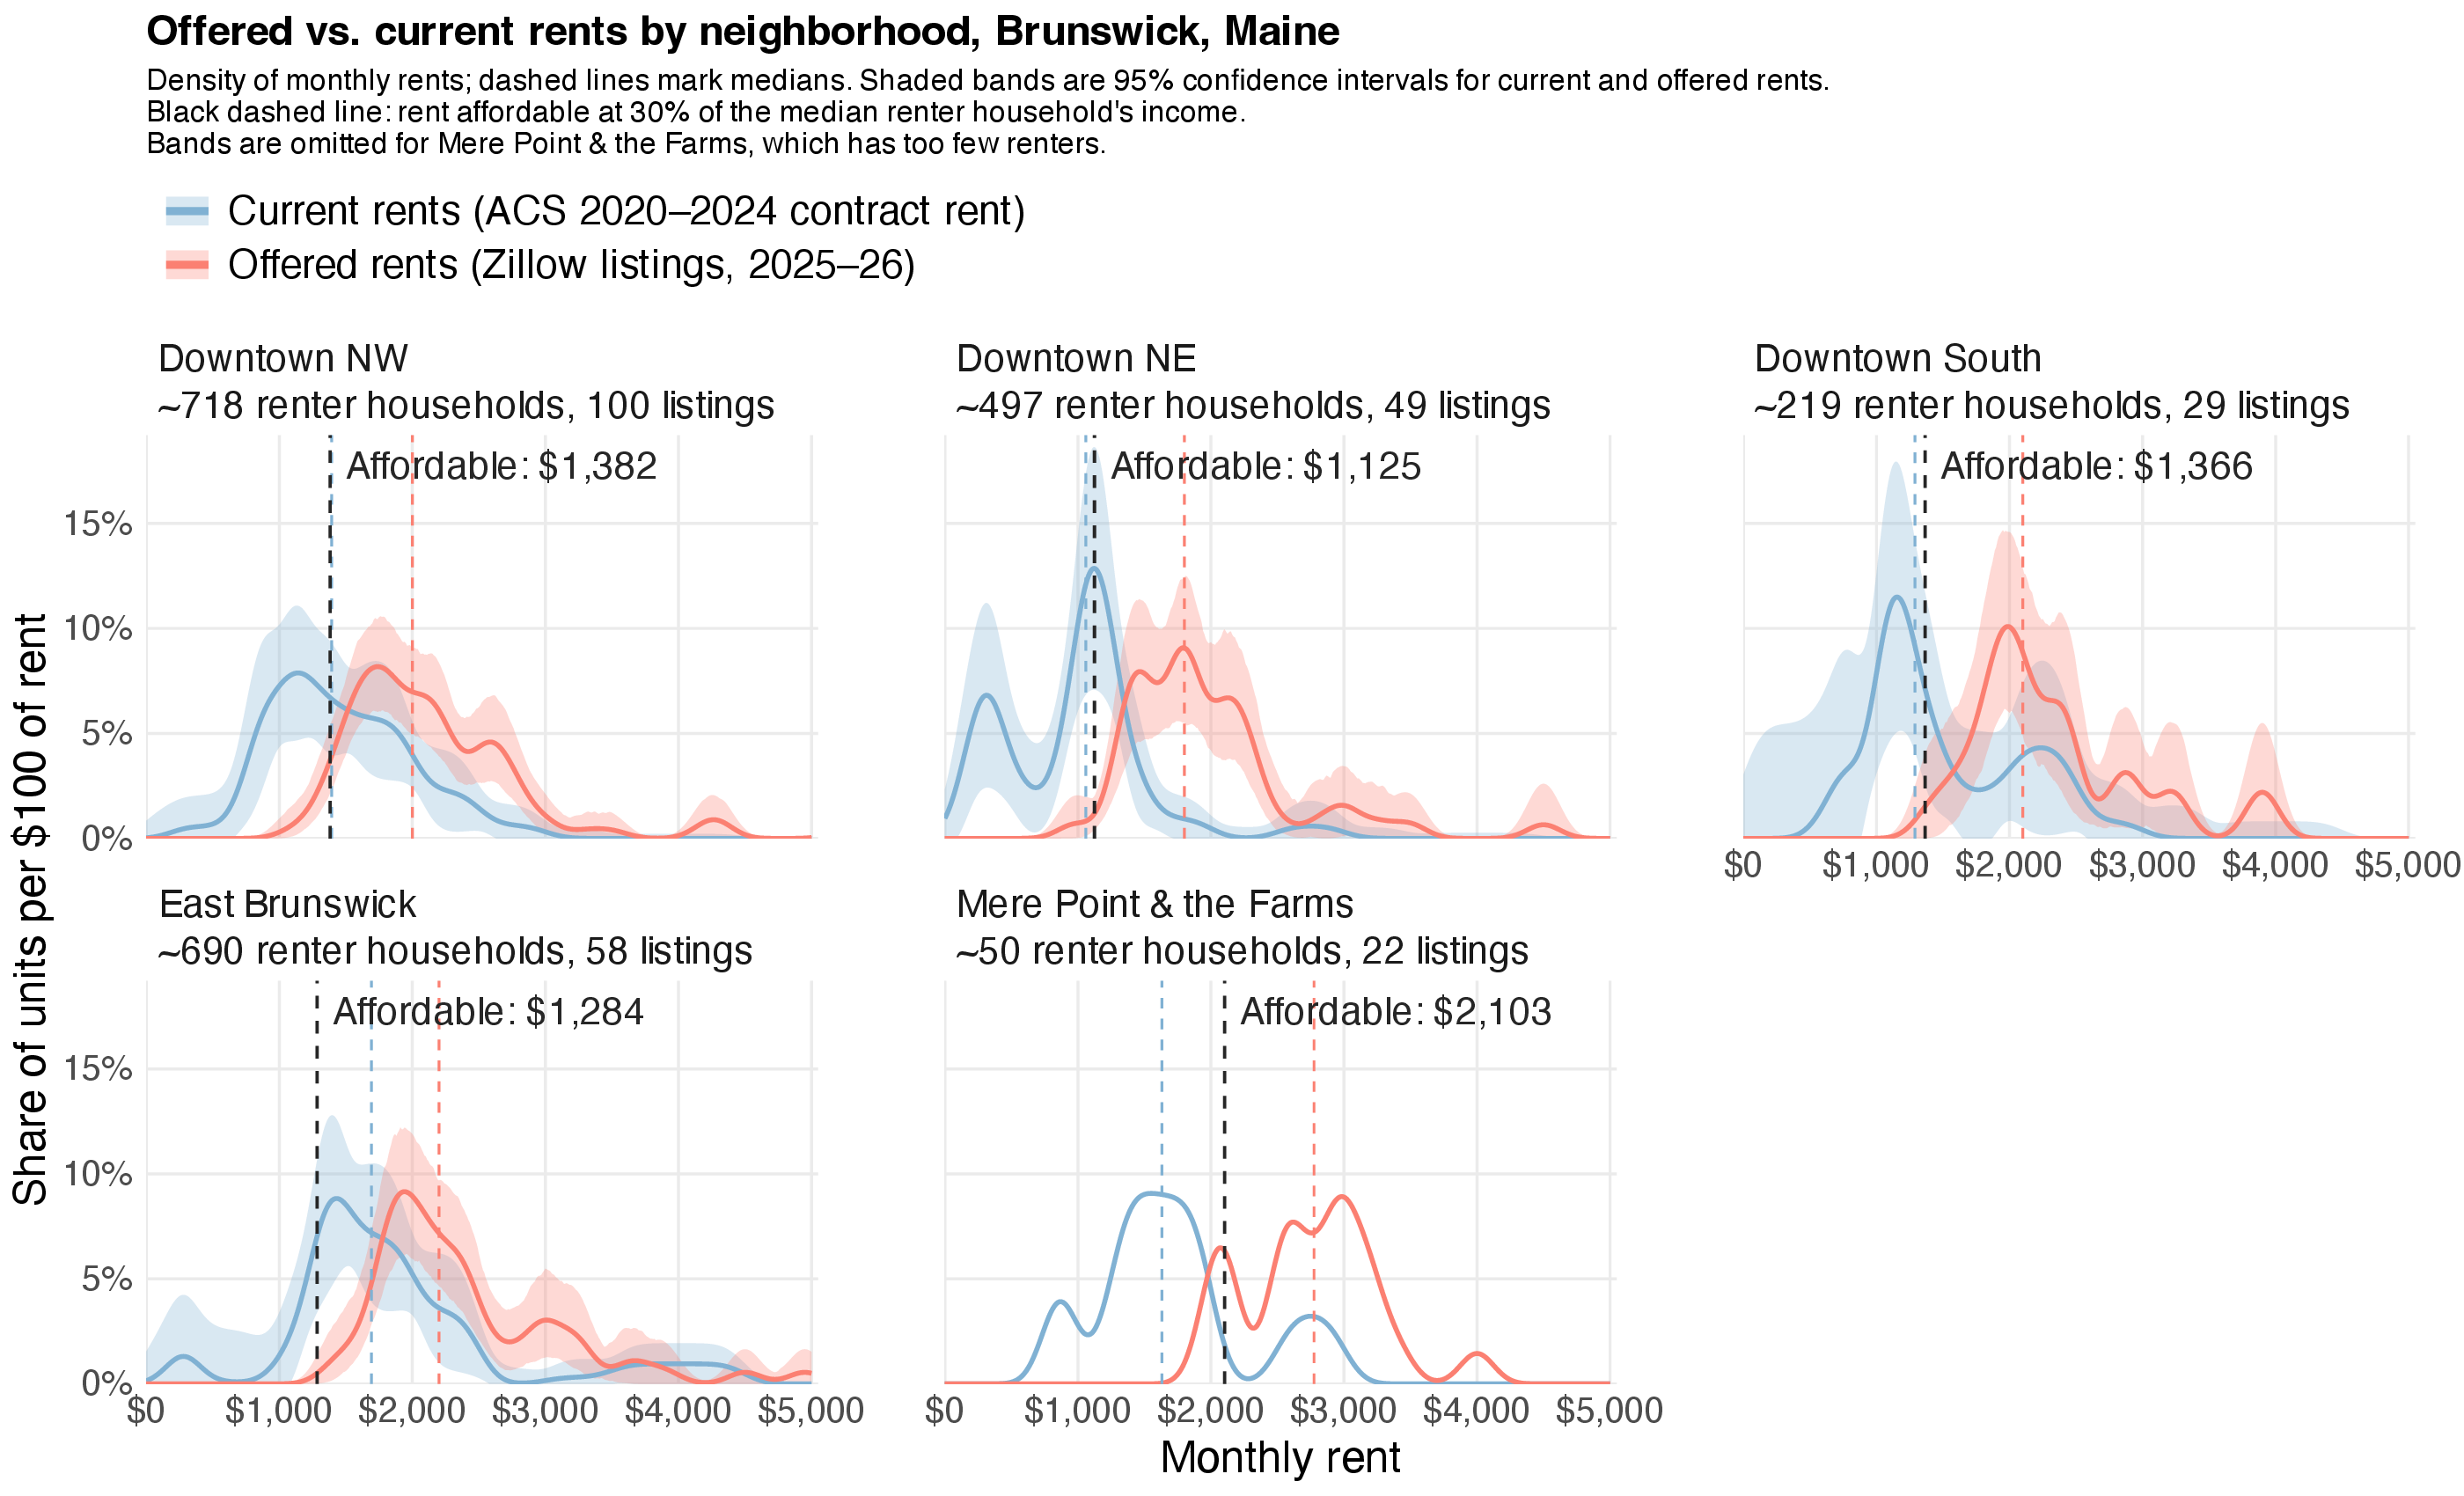
Asking rents exceed what renters can afford in every neighborhood
![Rent distributions by Brunswick neighborhood, current rents and Zillow asking rents]()
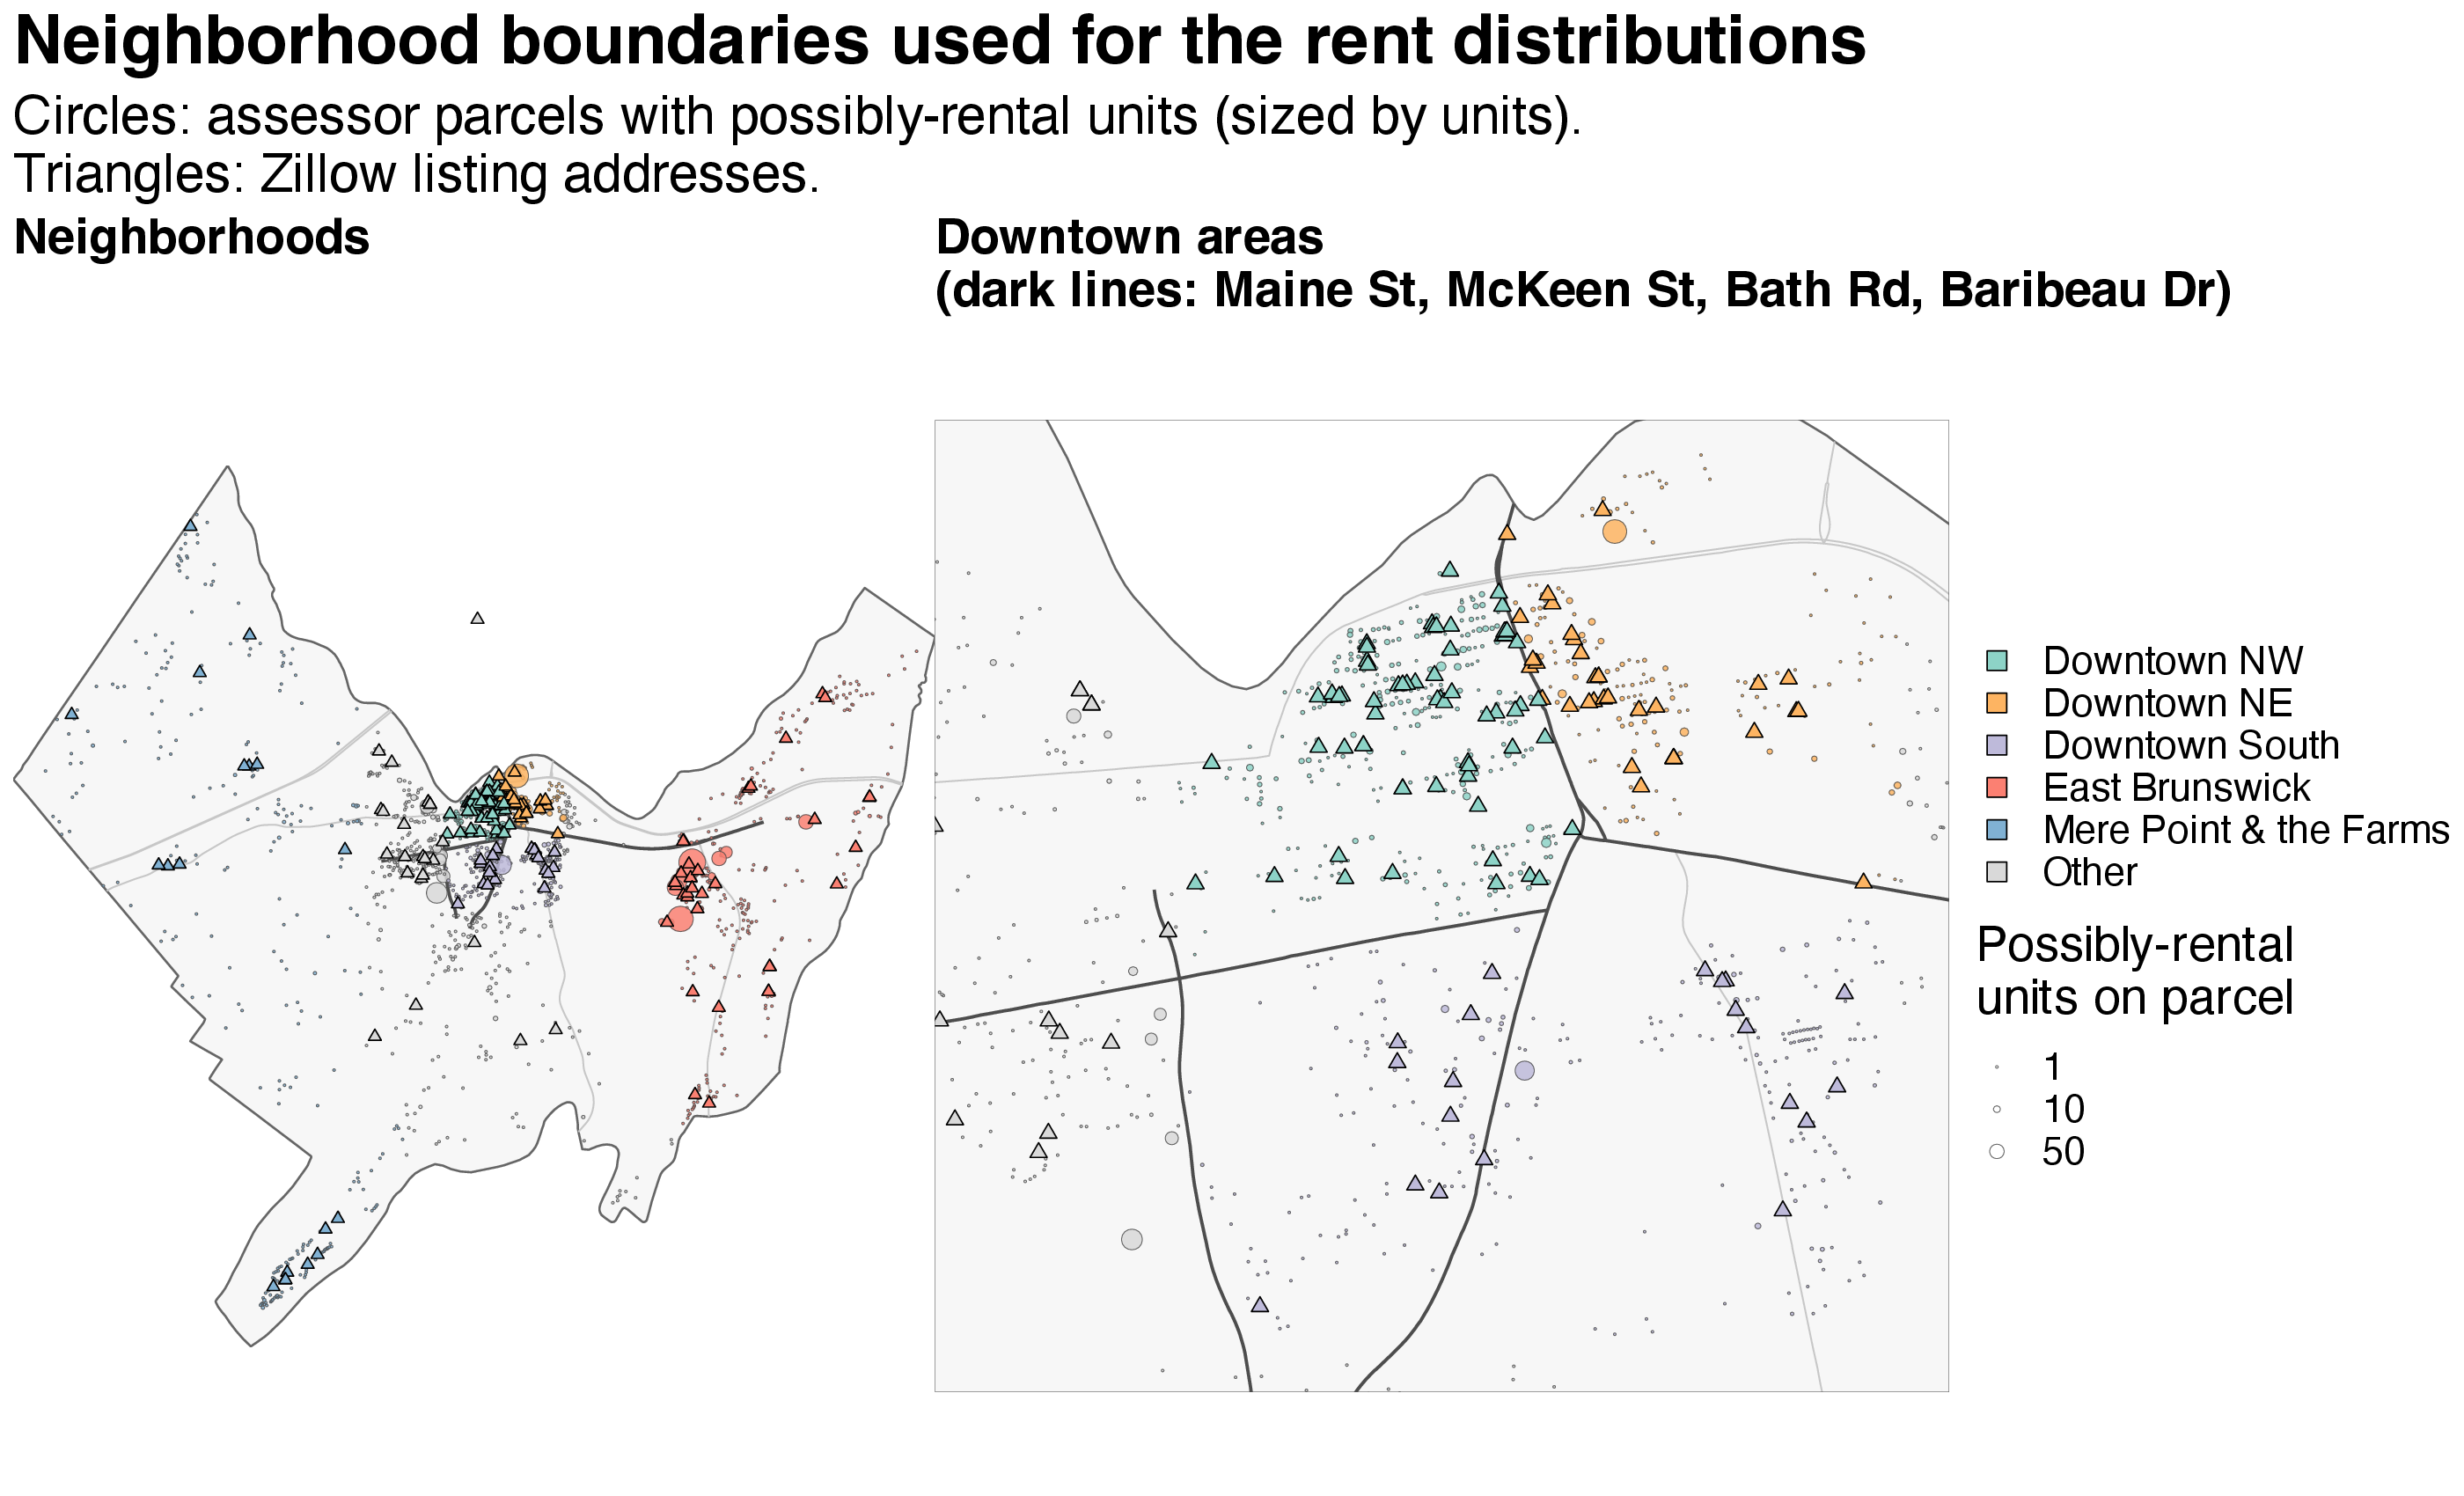
The neighborhoods used in these charts
![Map of Brunswick colored by neighborhood, with a close-up of downtown]()
Left: the whole town, colored by neighborhood. Right: a close-up of downtown, split into quarters by Maine St, McKeen St, and Bath Rd. Circles are homes that may be rented; triangles are Zillow listings.
Part 2: Why are rents rising?
How rents depend on the number of empty rentals
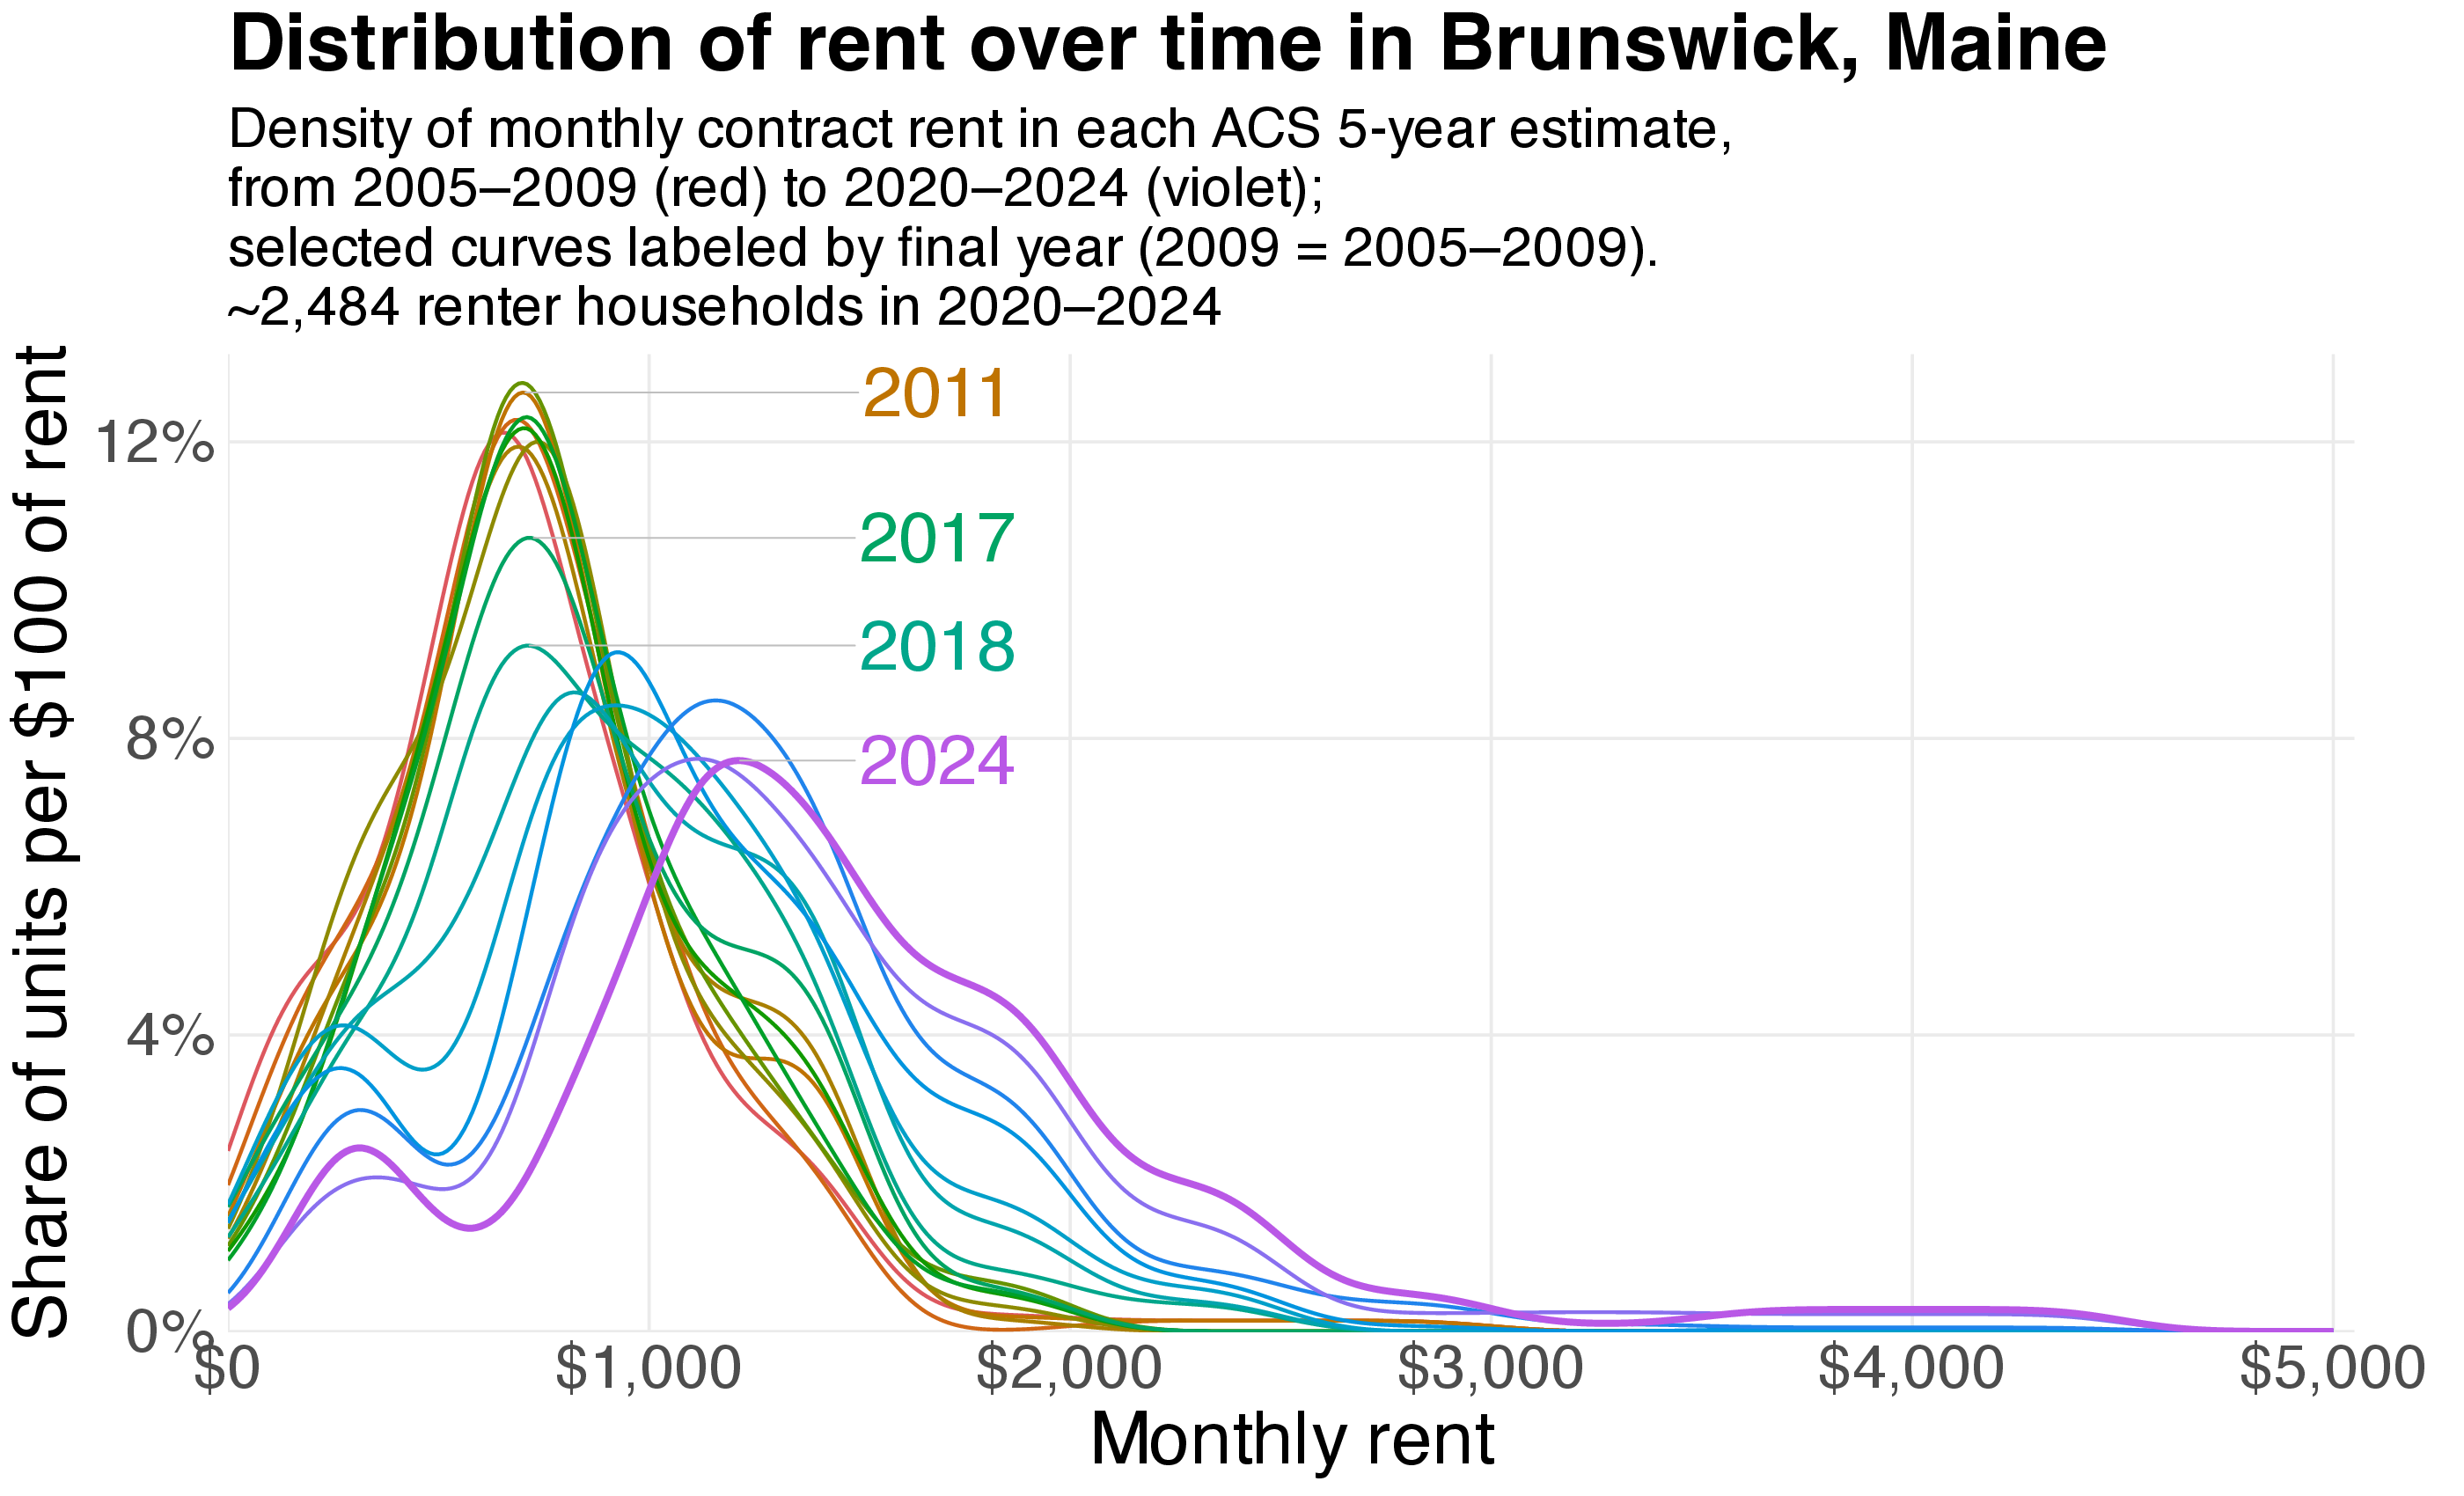
When and how did rents change?
![Distribution of Brunswick rents in each ACS 5-year estimate]()
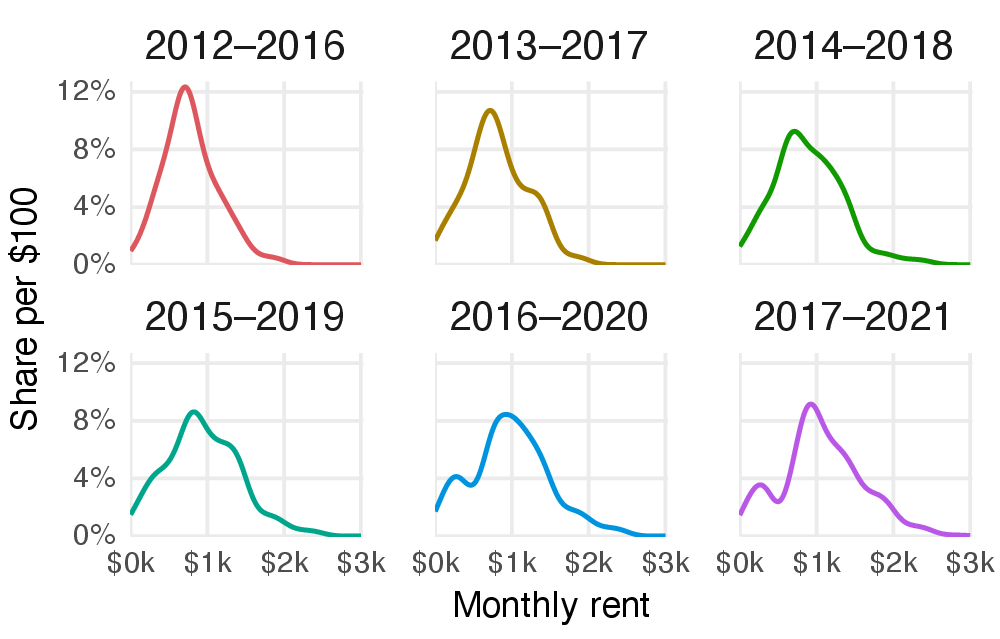
- The whole curve moved to the right after 2016/2017: rents went up for everyone, not just at the top. The median rent rose from $735 (2011–2015) to $1,360 (2020–2024).
- Covid exacerbated but did not start the crisis.
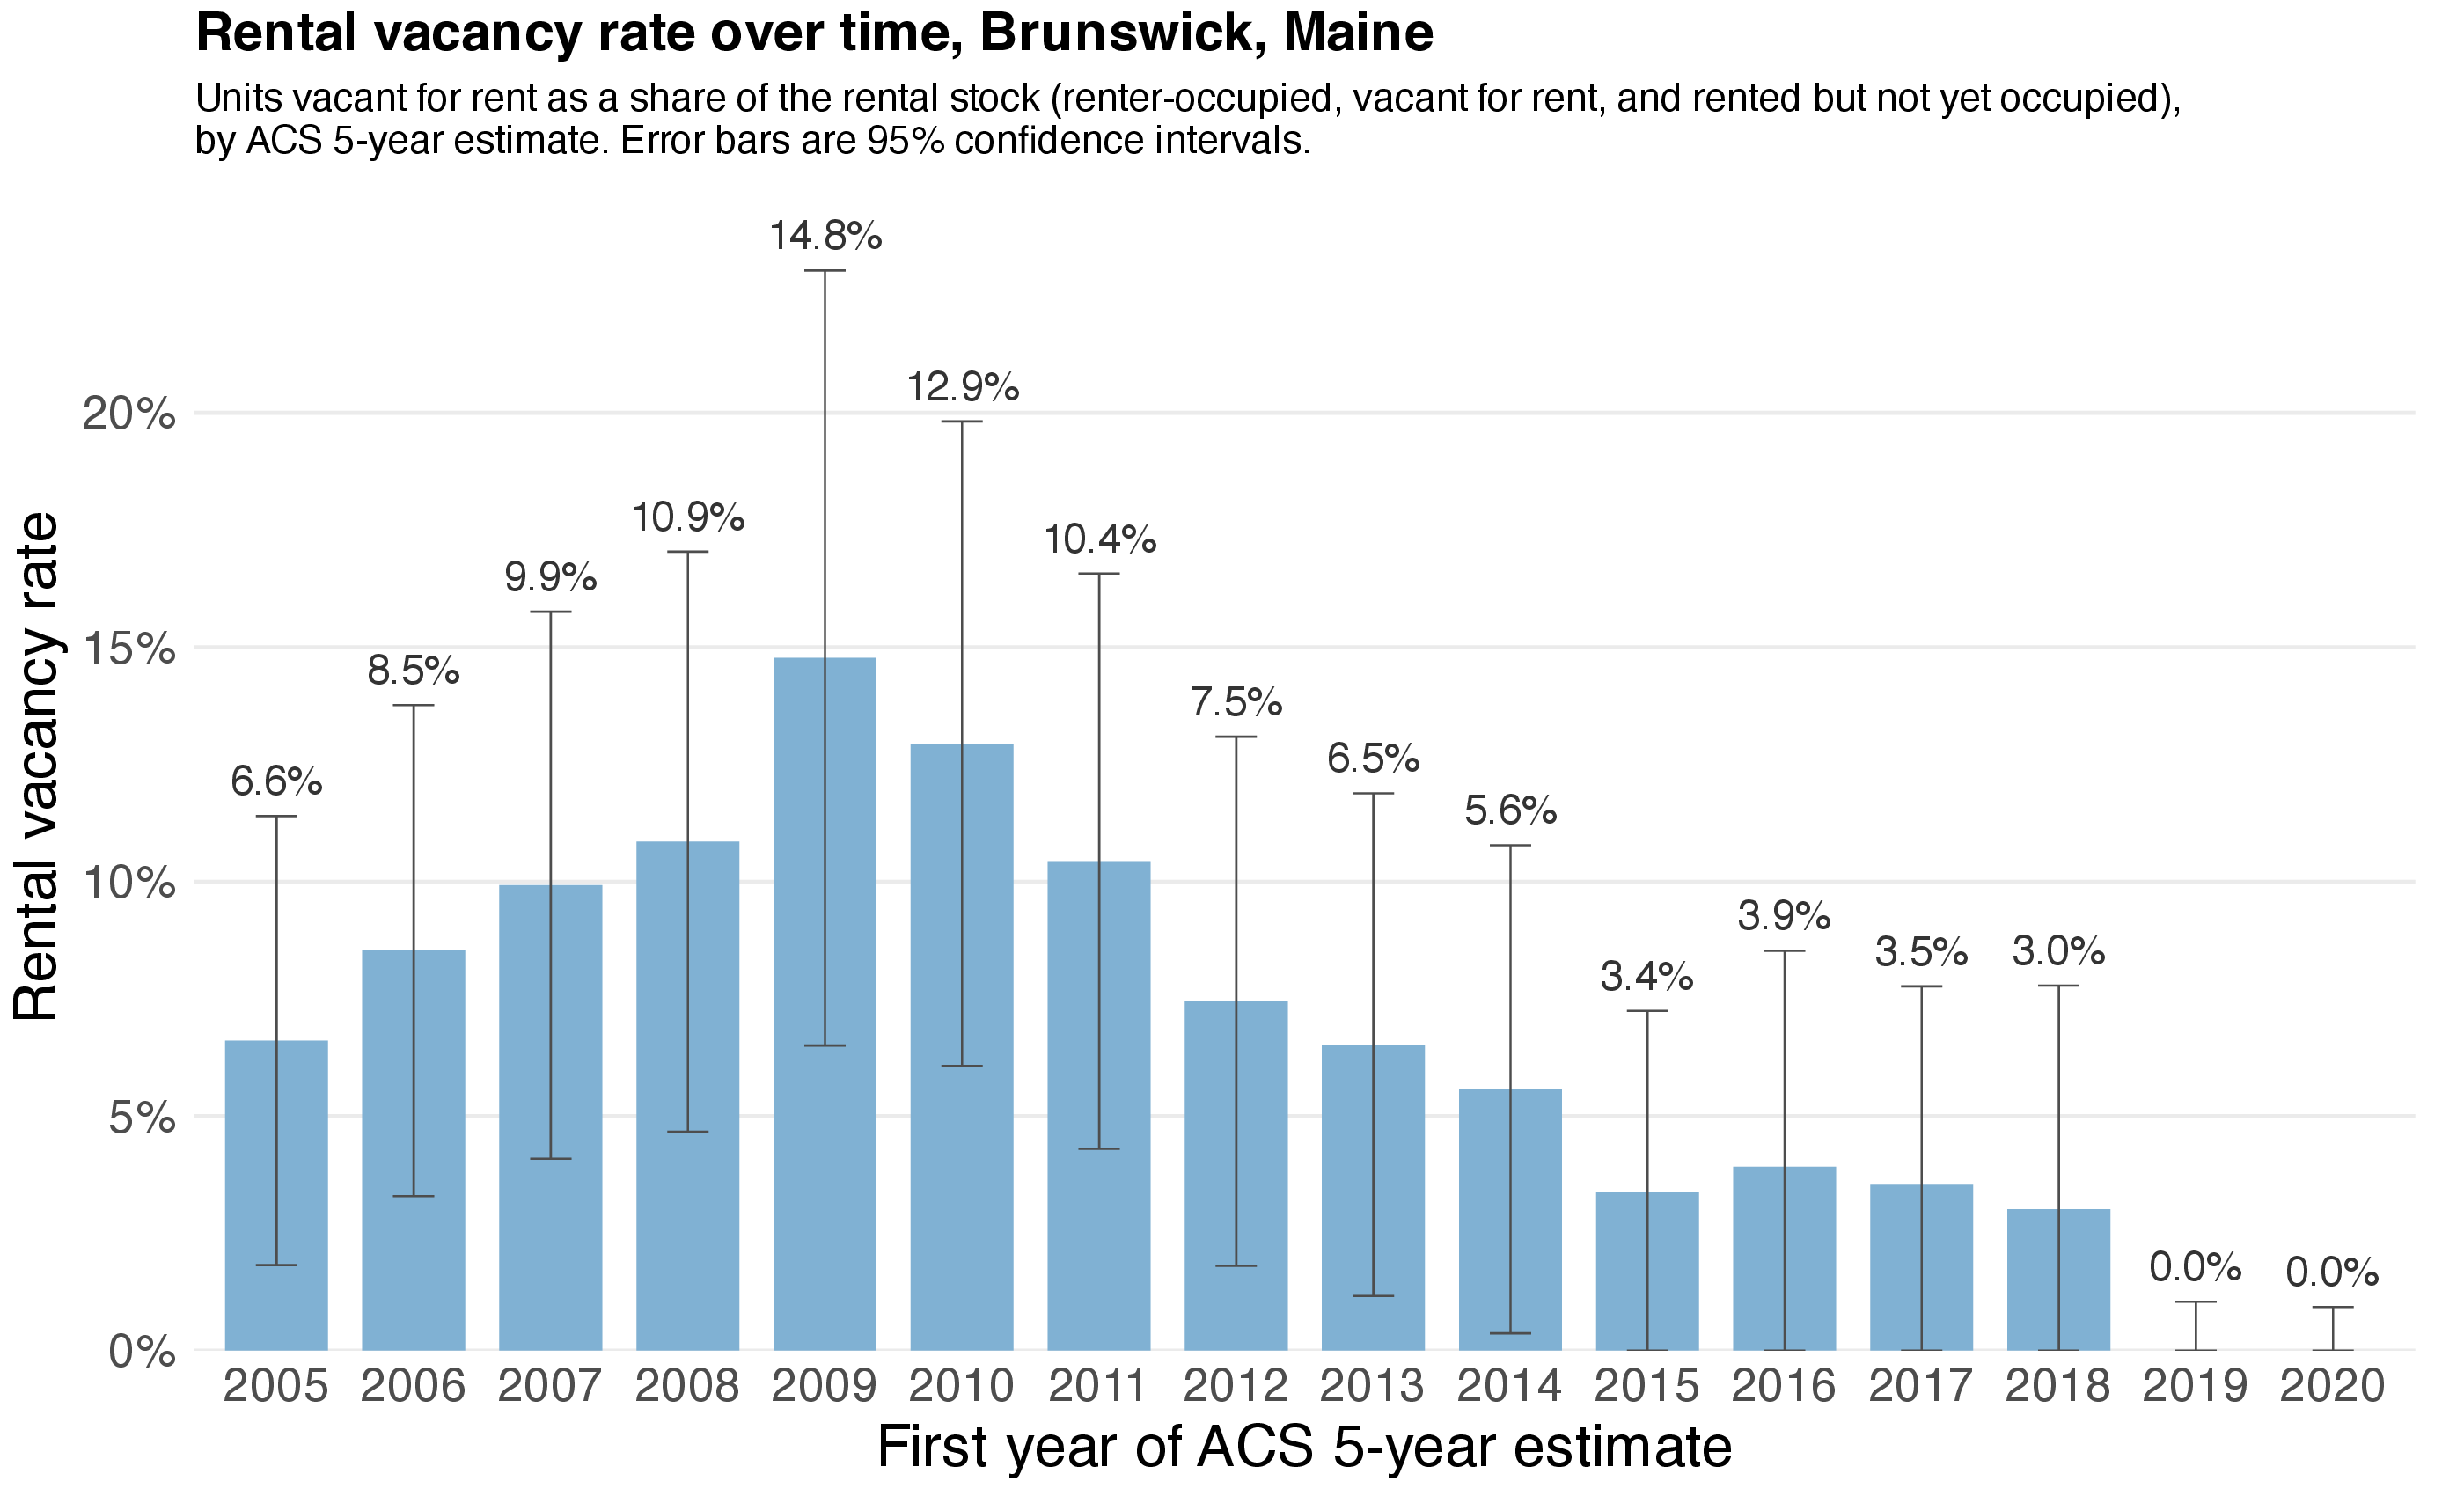
Brunswick has run out of vacant rentals
![Brunswick rental vacancy rate in each ACS 5-year estimate]()
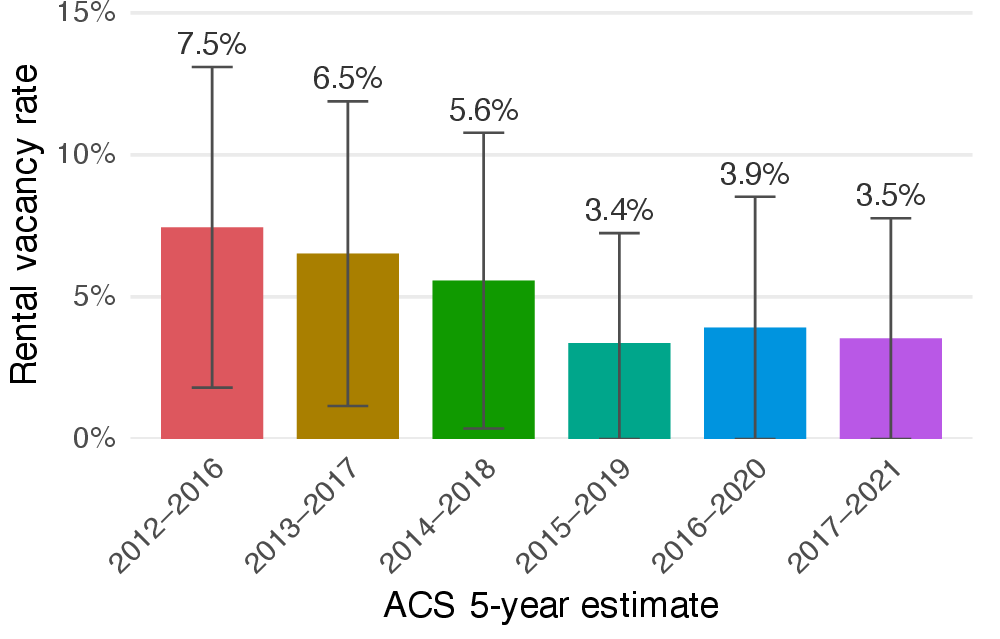
- About 15% of rentals were empty in the 2009–2013 estimate. In the two most recent estimates, the survey found almost none.
- These data include the period after the conclusion of Covid emergency measures.
Rents and the vacancy rate in Brunswick, 2012–2021
Distribution of rent
![Rent distributions in Brunswick, ACS estimates 2012 to 2021]()
Rental vacancy rate
![Brunswick rental vacancy rate, ACS estimates 2012 to 2021]()
While about 6.5–7.5% of rentals were empty (the first two estimates), rents held steady. As the vacancy rate fell below 6%, the rent curves began to move to the right.
Rents follow the vacancy rate
Rents change according to the availability of rentals, the vacancy rate.
Few empty rentals
- Many people compete for each apartment.
- Landlords can raise the rent and still fill it.
- Rents rise.
Many empty rentals
- Landlords compete for each tenant.
- They must lower rents or offer deals to fill units.
- Rents fall.
A healthy market always has some empty rentals: people move, families grow, students arrive, and units sit empty between tenants or for repairs. The natural vacancy rate of a community is the vacancy rate that causes no pressure on rental prices. At that rate, rents hold steady.
A simple model of rents and vacancy
Let \(R_t\) be the rent in year \(t\), \(v\) the current vacancy rate, and \(v_n\) the natural vacancy rate. A simplistic model says:
\[
\underbrace{\frac{R_t - R_{t-1}}{R_{t-1}}}_{\text{percent change in rent}}
= \lambda \times \underbrace{(v_n - v)}_{\text{shortage of empty rentals}}, \qquad \lambda > 0
\]
where \(\lambda\) is how quickly rents respond.
- \(v < v_n\): too few vacant units, so rents rise
- \(v > v_n\): too many vacant units, so rents fall
- \(v = v_n\): rents hold steady
What is the natural vacancy rate of Brunswick?
What is a reasonable natural vacancy rate for Brunswick?
Natural vacancy rate of 6–7%?
Brunswick’s own history: rents held steady when the vacancy rate was about 6.5–7.5%, and started rising when it fell lower.
Other benchmarks:
- 5% is a common threshold for rent protections.
- Maine currently has a vacancy rate of 4.2%.
- The suburban vacancy rate across the US is 7%.
Economists have studied the natural vacancy rate since the 1980s; estimates for U.S. cities vary widely, and many are higher than 6%. (See the sources at the end.)
Part 3: Short-term rentals
How much of the room the town needs do short-term rentals use?
Short-term rentals take homes off the long-term market
- A home rented to visitors is not available to someone who wants to live in Brunswick.
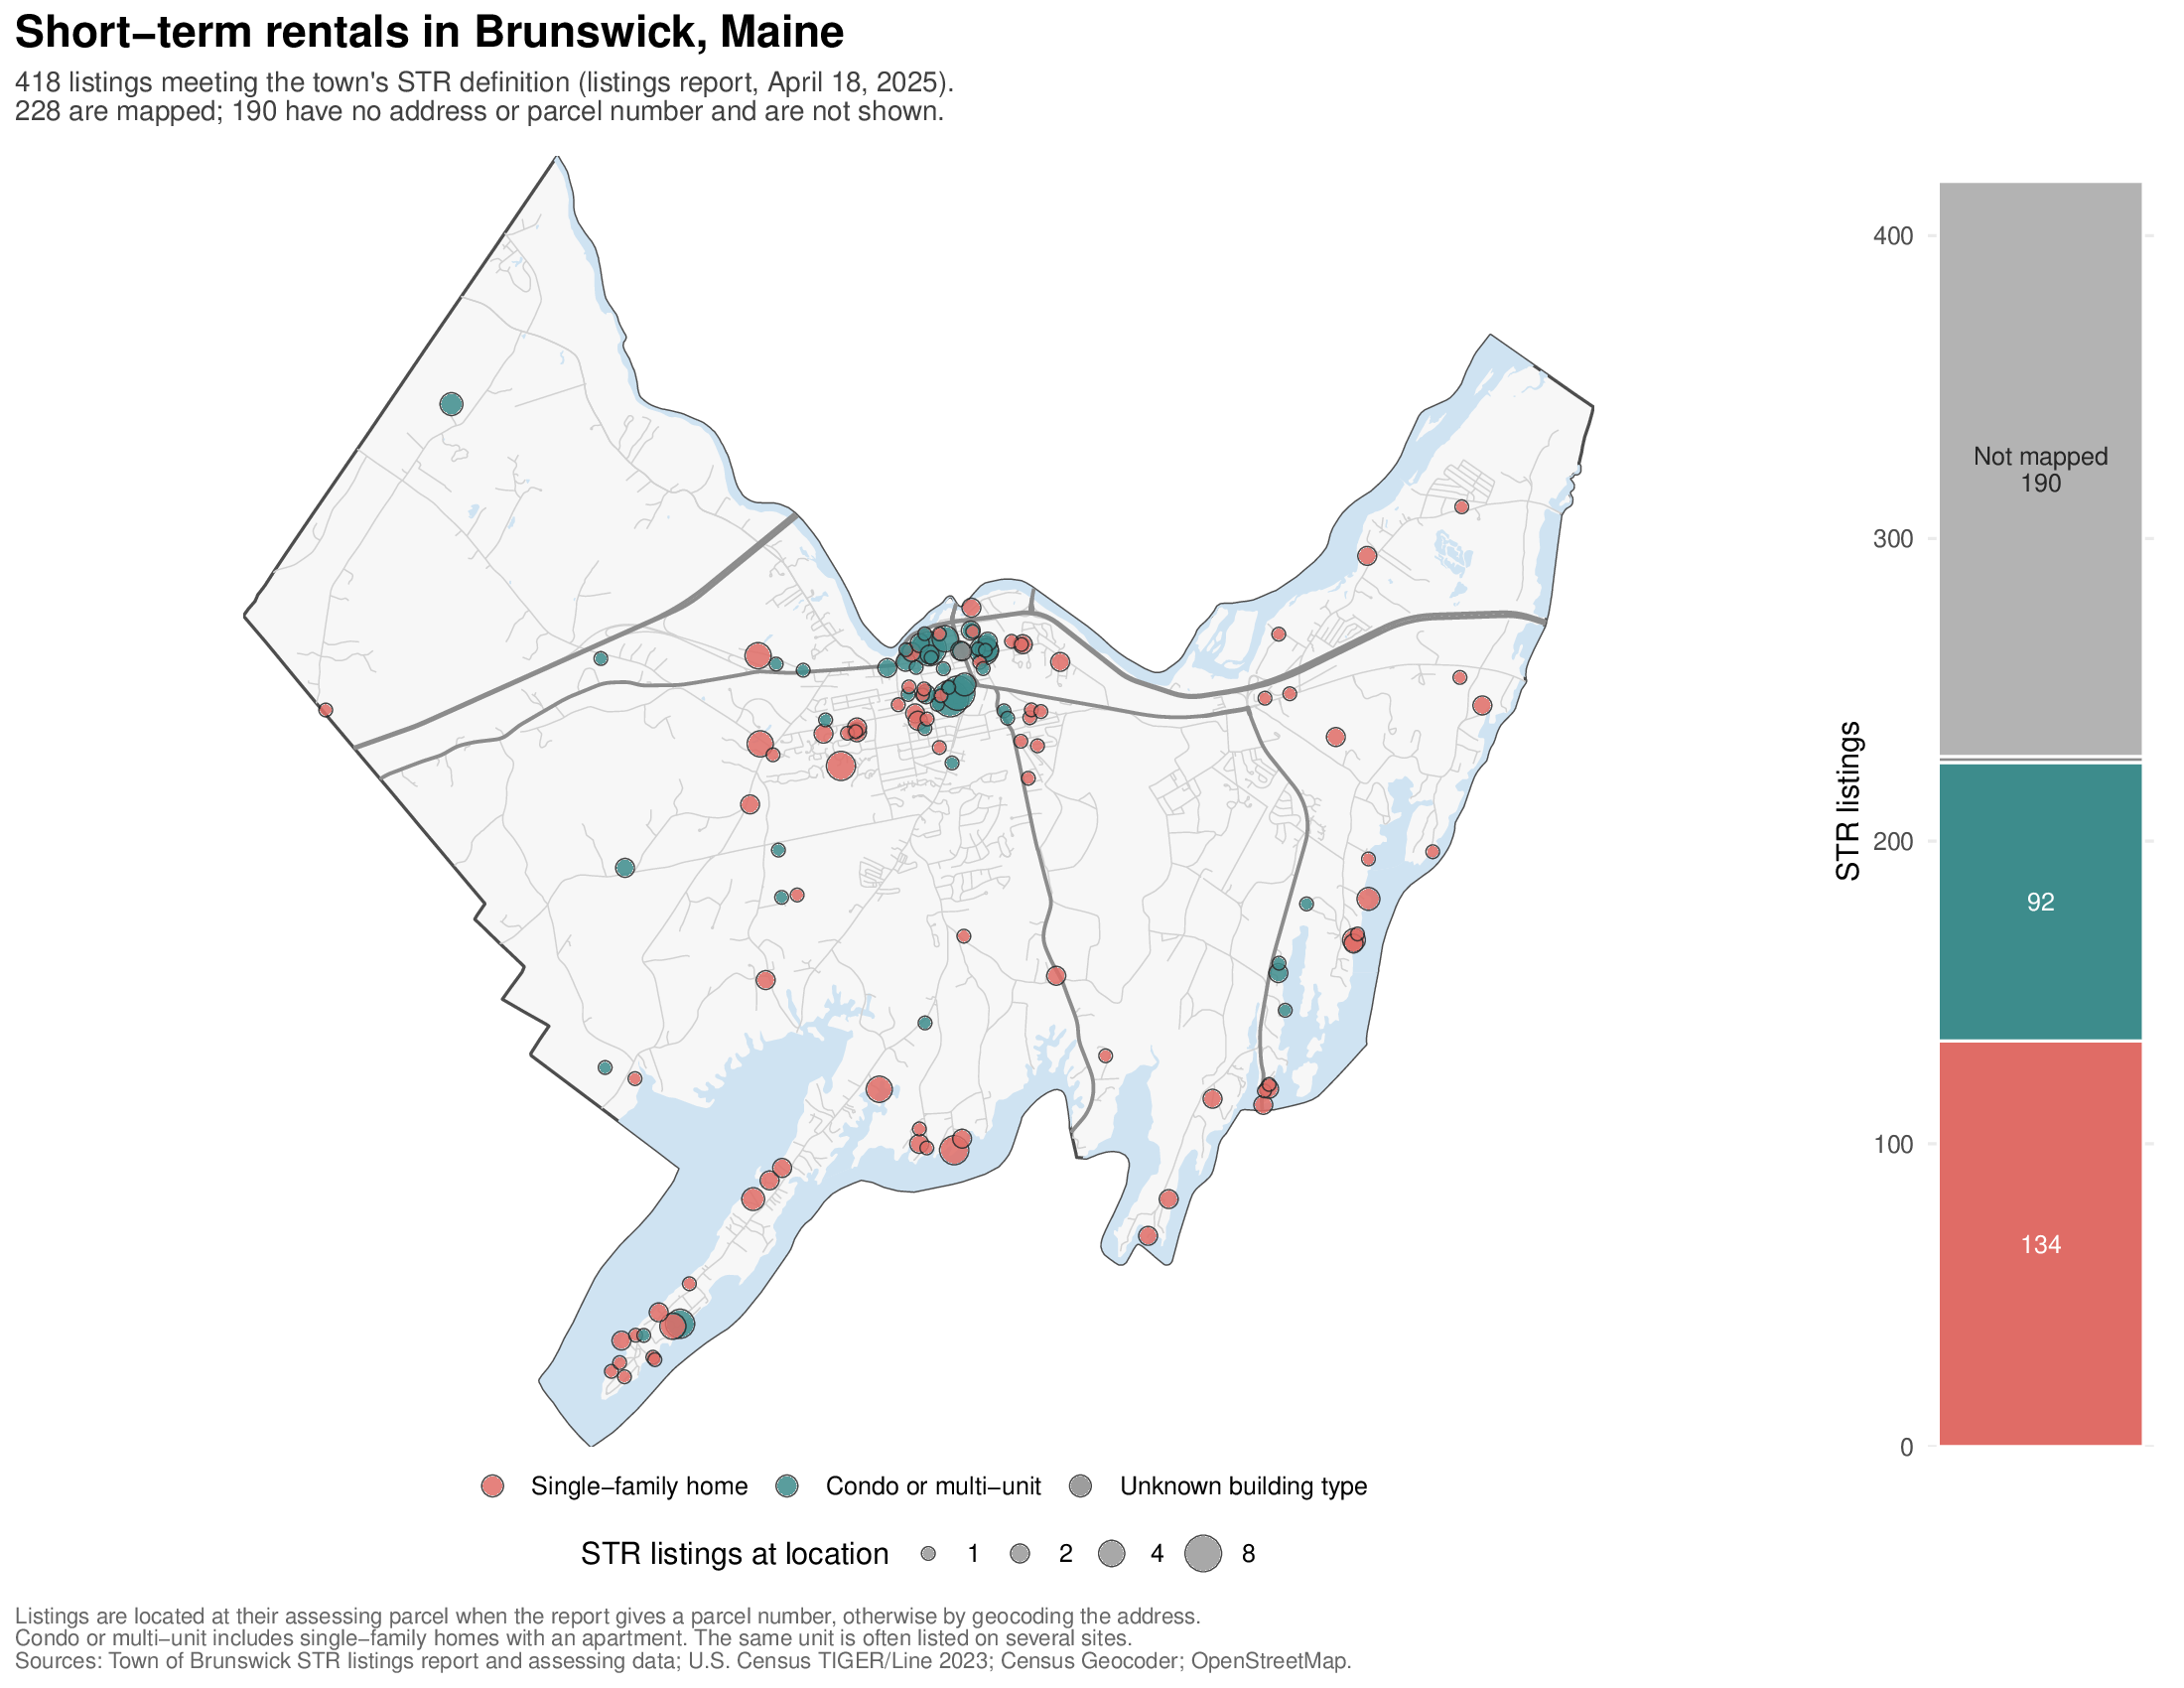
- In April 2025, the town’s report listed 418 short-term rental listings that meet the town’s definition of an STR.
- The same home can be listed on more than one website, so 418 listings is not the same as 418 homes.
- We could place 228 listings on a map, using their address or parcel number. The other 190 (45%) had no address or parcel number in the report.
- Everything that follows counts only the mapped STRs, so it understates their effect.
Where Brunswick’s short-term rentals are
![Map of Brunswick's short-term rental listings by building type, with a bar of mapped and unmapped listings]()
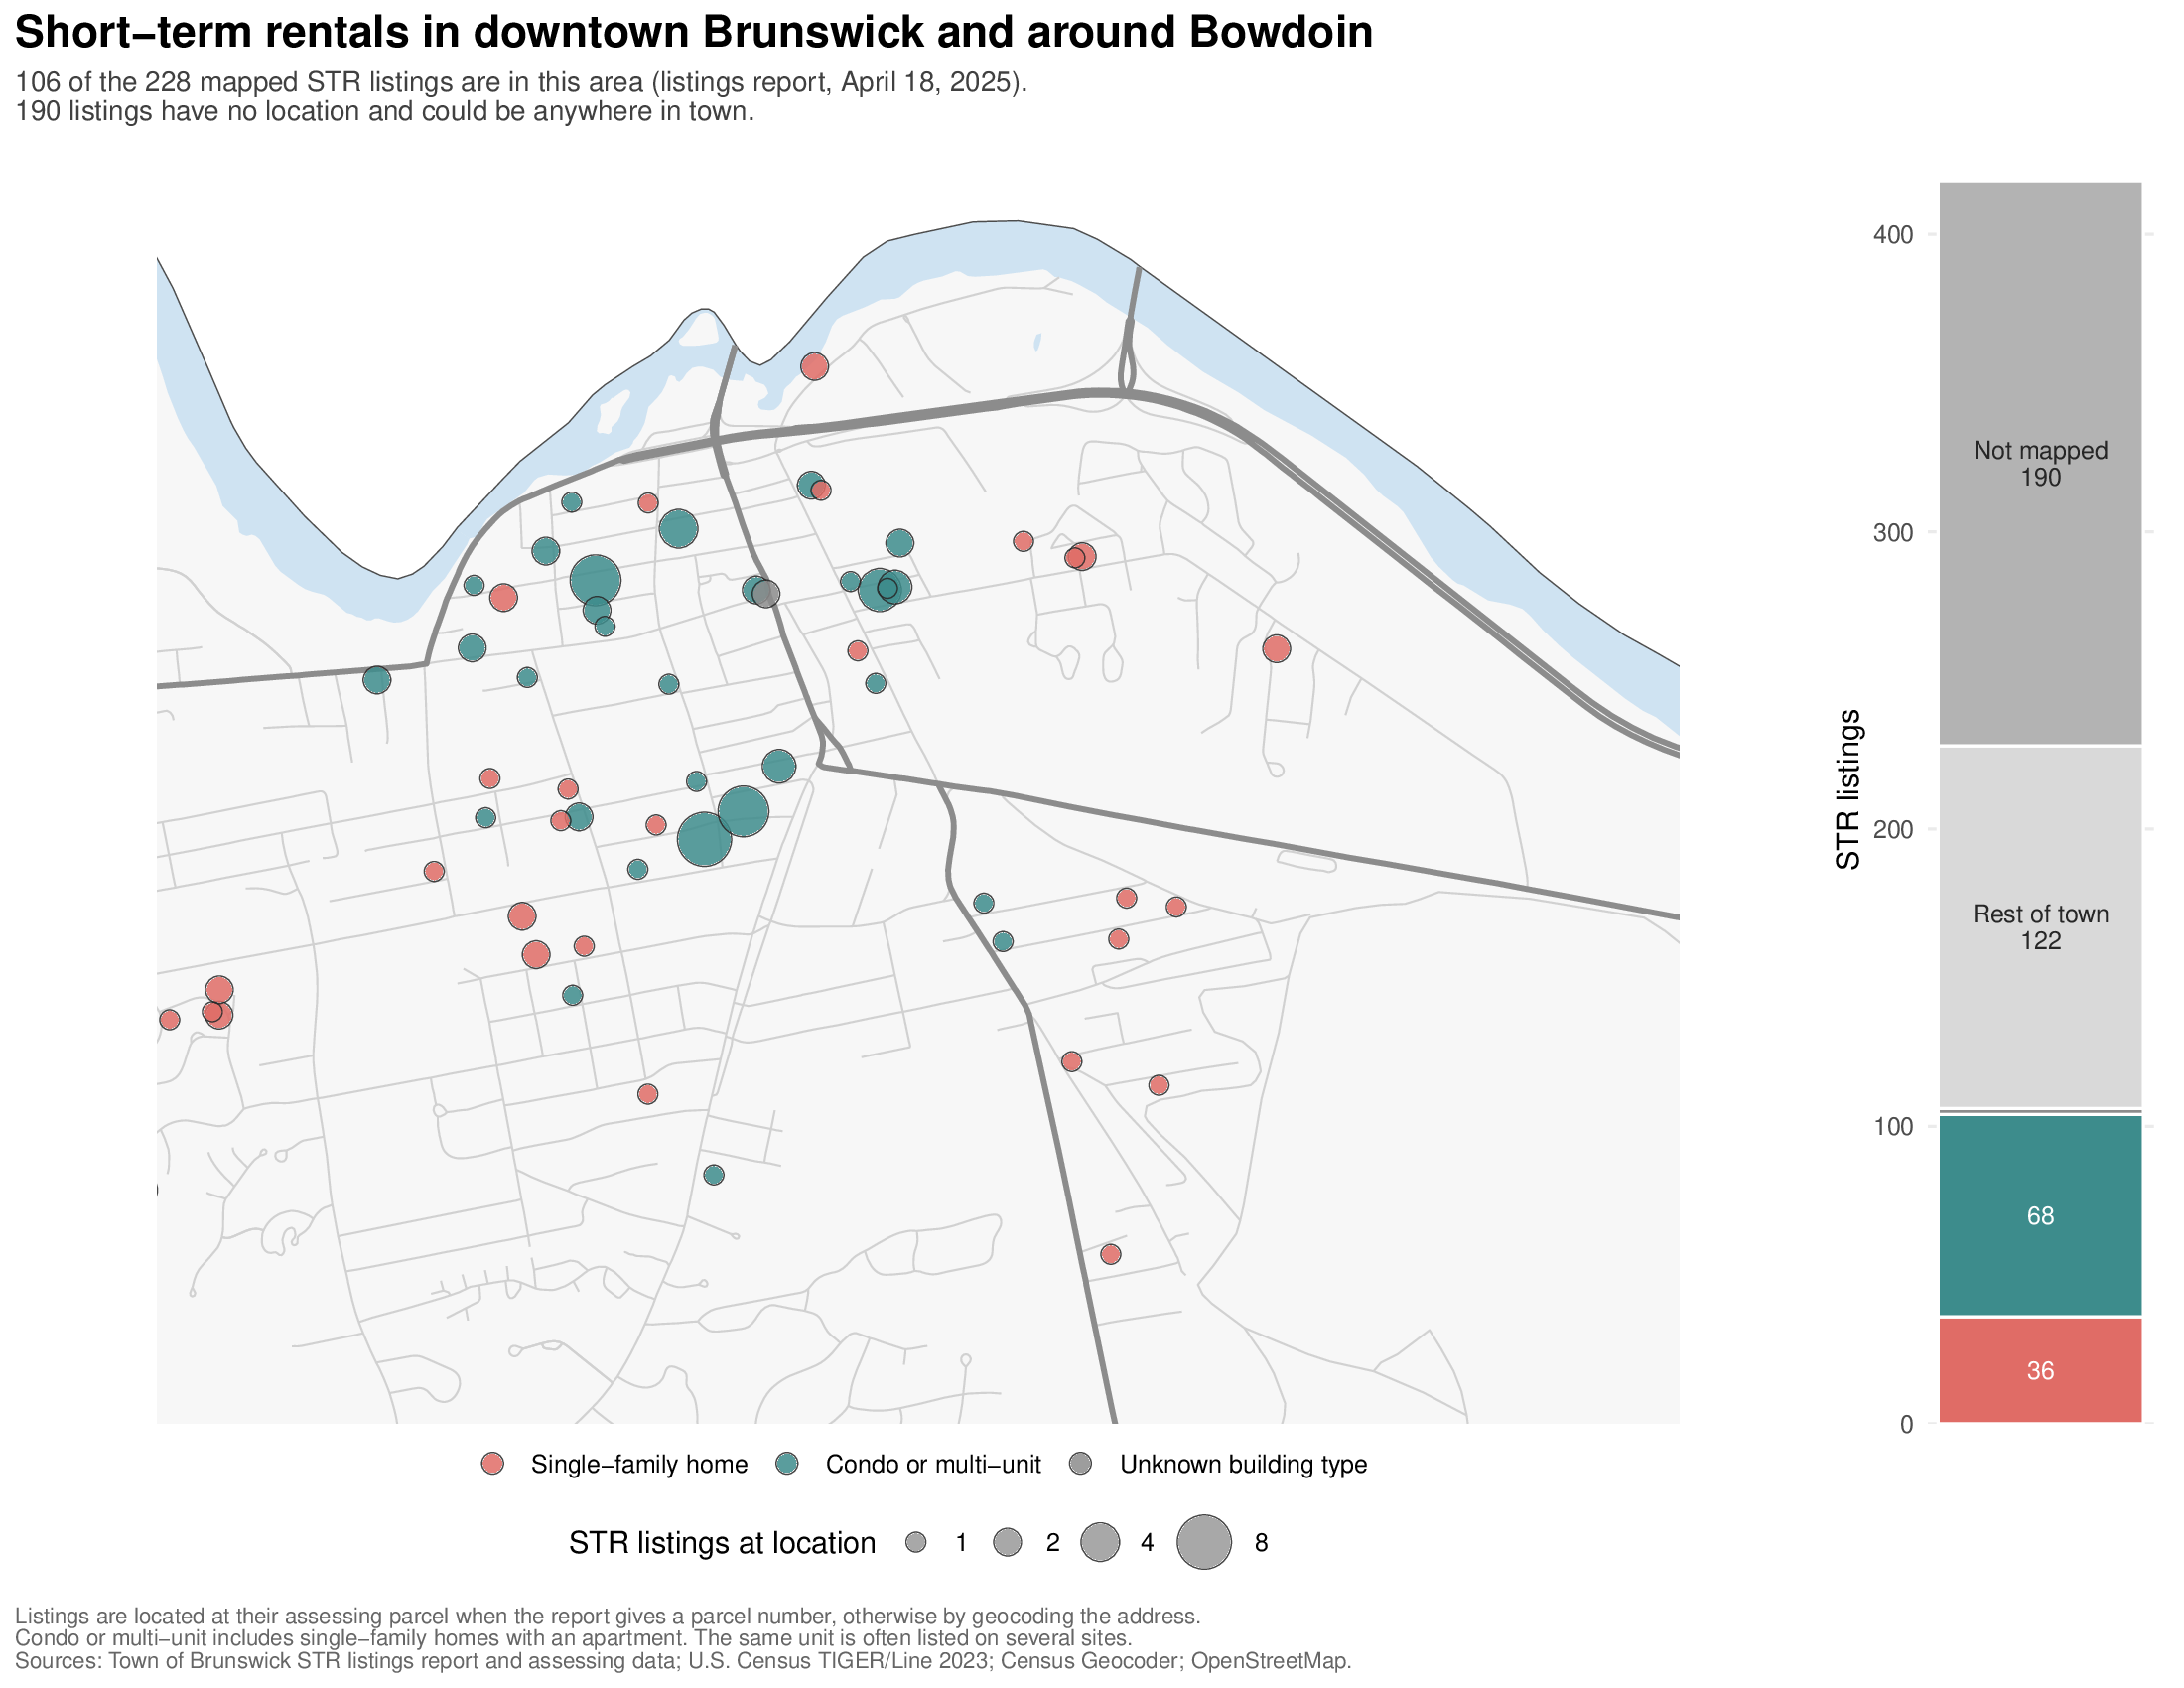
Downtown, most STRs are in condos and multi-unit buildings
![Close-up map of downtown Brunswick's short-term rental listings by building type]()
Mapped STRs take up 55% of natural vacancy rate
| Single-family home |
36 |
30 |
68 |
– |
134 |
724 |
| Condo, multi-unit, SFH w/ apt. |
68 |
5 |
19 |
– |
92 |
2,186 |
| Building type unknown |
2 |
– |
– |
190 |
192 |
– |
| Total |
106 |
35 |
87 |
190 |
418 |
3,738 |
Listings meeting the town’s STR definition, April 18, 2025; a unit may be listed on several sites. Not mapped: no address or parcel number in the town’s report. Rental units: assessing-data units that are rented or have no owner-occupant, excluding STRs; the total includes 828 mobile homes, senior living, and other units. The 228 mapped listings are 151 distinct units (77 downtown); shares are units out of rental units plus STR units.
- STRs take up 3.9% of the rental units in the town.
- STRs take up 3.5% of the rental units downtown.
- This only counts the mapped STRs. 45% are not mapped.
If we assume a natural vacancy rate of 7%, then just the mapped STRs occupy 55% of them.
Why 55%?
- For rents to hold steady, about 7 out of every 100 rental homes should be empty and available.
- The 228 listings we can map are 151 distinct homes. That is about 3.9 of every 100 rental homes in town (151 out of 3,889).
- 3.88 ÷ 7 ≈ 0.55. So the mapped STRs equal about 55% of the empty rentals that a healthy market needs.
- Brunswick’s vacancy rate is near zero. If those homes were rented to residents instead, they would fill more than half of the gap between that and a 7% natural rate.
- The 190 STR listings we could not map would add to this.
Summary
- Renters are struggling. 56% of Brunswick renters are cost burdened, up from 40% in the 2016–2020 estimate. New listings ask about $2,100 a month; the typical renter can afford about $1,243.
- Rents are rising because empty rentals have disappeared. Rents held steady when about 6–7% of rentals were empty. Today the survey finds almost none.
- Short-term rentals use a large share of the room the town needs. The STRs we can map equal about 55% of a 7% natural vacancy rate, and 45% of listings could not be mapped at all.
Data, code, and sources
Data used in this analysis
- U.S. Census Bureau, American Community Survey 5-year estimates, 2005–09 to 2020–24, Brunswick town and block groups: B25003, B25004 (vacancy), B25056 (rent), B25074 (renter income), B25106 (cost burden).
- Town of Brunswick, short-term rental listings report, April 18, 2025.
- Town of Brunswick assessing data (parcels, property cards), Sept. 2026.
- Zillow rental listings for Brunswick, collected daily, June 2025–April 2026.
- Census TIGER/Line 2023; Census Geocoder; OpenStreetMap.
Code
One commented R script makes every figure and table. The original slides are also available as a PDF.
Sources for other claims
- Cost burden (30%+ of income): HUD, “Rental Burdens: Rethinking Affordability Measures,” PD&R Edge, 2014.
- 5% threshold: N.Y. Emergency Tenant Protection Act of 1974, Unconsol. Laws § 8623(a).
- U.S. suburban rental vacancy, 6.9%: Census Bureau, Housing Vacancies and Homeownership (CPS/HVS), Q4 2025.
- Maine rental vacancy rate: Census Bureau, ACS 2020–24 5-year estimates, table DP04.
The natural vacancy rate
- Rosen & Smith (1983). The price-adjustment process for rental housing and the natural vacancy rate. American Economic Review 73(4): 779–786.
- Gabriel & Nothaft (1988). Rental housing markets and the natural vacancy rate. AREUEA Journal 16(4): 419–429.
- Gabriel & Nothaft (2001). Rental housing markets, the incidence and duration of vacancy, and the natural vacancy rate. Journal of Urban Economics 49(1): 121–149.